
May’s inflation data is largely in. The table below summarises the releases and what it might mean for bond yields:
| Region | May Inflation Reading | Key Drivers | What Has Changed? | 3-Month Inflation Projection | Likely Bond Yield Impact |
| United States | Headline CPI 4.2%; Core 2.9%; Headline PPI 6.5%; Core PPI 4.9% | Energy (gasoline +23.4%), shelter, transport services. Energy accounted for over 60% of the monthly increase; core inflation increasingly broad-based. | Inflation no longer solely a consumer price story. Producer (PPI) inflation has accelerated to its highest since 2022 implying further pipeline pressure. Headline CPI accelerated sharply; core CPI contained for now but outlook is not great. | 3.8 – 4.5% (base case 4.3%) | US 10y likely 4.75 – 5.25% (base case 4.90%) |
| Eurozone | Headline CPI 3.2%; Core 2.5% | Energy and services. Services inflation has accelerated, suggesting broader pass-through. | Inflation broadening beyond energy. | 3.0 – 3.8% (base case 3.4%) | German 10y 3.0 – 3.5% (base case 3.25%) |
| United Kingdom | April Headline CPI 2.8% (May pending) | Energy, imported goods, retail prices, wage pressure. | UK likely at inflation trough rather than peak. | 3.0 – 4.0% (base case 3.5%) | UK 10y Gilt 5.0 – 5.25% (base case 5.1%) |
| Japan | Tokyo CPI 1.3%; producer/import inflation rising | Energy imports, weaker Yen, rising wholesale prices. | Pipeline inflation building despite subdued CPI. | 1.5 – 2.5% (base case 2.0%) | JGB 10y 2.75 – 3.25% (base case 3.0%) |
| China | Headline CPI 1.2%; Headline PPI 3.9% | Energy, industrial commodities, AI-related demand. Food remains weak. | Producer inflation accelerating but consumer inflation remains subdued. | 1.0 – 1.8% (base case 1.3%) | Chinese yields broadly stable; limited direct impact |
| Global Summary | Inflation rising across most major economies | Energy à Freight àProducer Prices à Services | Inflation increasingly broad-based. | Global inflation likely remains above central-bank targets through Q3 2026 | Global sovereign yields biased upward |
The projections are not forecasts in the traditional economic sense. They are based on three transmission channels: (1) Energy(currently rising but an unknown in the next three months); (2) Freight/Transportation (starting to rise and more pass-through is likely in the next three months) and (3) Services/Wages (beginning to rise and poses the biggest risk in the next three months). Historically, this is how the transmission channel unfolds:
- Month 0–1: Oil rises and Energy CPI rises (hence the rise in the headline rate)
- Month 2–4: Freight rises and Producer prices rise.
- Month 3–6: Services inflation rises and Wage demands increase This is where we are now! Core inflation rises.
- Month 6–12: Core inflation becomes embedded.
……and this is why bond markets usually react before inflation fully appears in the data! Wednesday’s CPI release suggested inflation was accelerating. Today’s PPI (Producer Price Index) release suggests it is beginning to spread. Headline US producer prices rose +6.5% y/y in May, the highest level since 2022; Core producer inflation rose +4.9% y/y. Energy remains the principal driver – but higher costs are increasingly appearing in transportation, chemicals and industrial inputs. In other words, inflation is moving through the economic transmission mechanism exactly as one would expect: Energy → Freight → Producer Prices → Services. While this remains considerably smaller than the inflation shock following Russia’s invasion of Ukraine in 2022, the direction of travel is similar. Bond markets are therefore not reacting to today’s inflation; instead, they are reacting to where inflation is likely to be in three to six months from now.
What is the bond market trying to tell us? Using the S&P 500, we can sum up the above impact of Inflation à Rates àValuation à Asset Allocation as shown in the table below. This table simply builds on the one shown in last week’s Week-in-Review (with a few tweaks):
| Scenario | Probability | 3M Headline Inflation Projection | US 10Y Yield | Valuation Impact | Market Outcome | Preferred Asset Allocation |
| Disinflation / AI Boom | 15%
(requires several things to go right simultaneously: successful Iran agreement, Brent falls to $80 – 85 pb, no wage pass-through, AI productivity offsets inflation) |
US: 3.5 – 3.8%EZ: 2.8 – 3.2%UK: 2.8 – 3.2% | 4.0 to 4.25% | Multiple Expansion | Strongly Positive | Winners:Nvidia, Microsoft, Technology, Semiconductors, AI Infrastructure, Consumer Discretionary, Small Caps.
Avoid: Energy, Gold, Defensive sectors. |
| Soft Landing (Market Consensus i.e. What Equities Are Pricing) | 40%
(closest to current market expectations: earnings remain +20 to +25%, inflation remains elevated but stable, yields remain around current levels) |
US: 4.0 – 4.2%EZ: 3.2 – 3.5%UK: 3.2 – 3.5% | 4.5 to 4.75% | Stable | Neutral | Winners: Large-Cap Growth, AI Leaders, Quality Companies, Financials, Infrastructure.
Avoid: Highly leveraged companies and speculative growth. |
| Sticky Inflation (Base Case) | 35%
(most consistent with current inflation data: energy increasingly feeding into transport, services and producer prices; bond markets continue demanding inflation compensation) |
US: 4.0 – 4.5%EZ: 3.4 – 3.8%UK: 3.5 – 4.0% | 4.75 to 5.25% | Mild Multiple Compression | Negative | Winners:Energy, Financials, Banks, Insurers, Selected Industrials, Gold.
Avoid: REITs, Utilities, Long-Duration Growth Stocks, Highly Leveraged Businesses. |
| Second Inflation Wave | 10%
(requires renewed Middle East escalation, Brent >$110 pb, broader wage inflation and inflation expectations becoming unanchored) |
US: 4.8 – 5.5%EZ: 4.0 – 4.5%UK: 4.5 – 5.5% | 5.25 to 5.75% | Severe Multiple Compression | Very Negative | Winners:Energy, Gold, Defence, Commodities, Cash, Ultra-Short Duration Bonds.
Avoid:Technology, Consumer Discretionary, Long-Duration Bonds, High-Multiple Equities. |
Last week, investors were betting on peace; this week, they are having to contemplate a world in which both inflation and conflict are moving in the wrong direction! The chart below is a stark reminder of just how quickly market narratives can change and why bond markets remain so cautious.
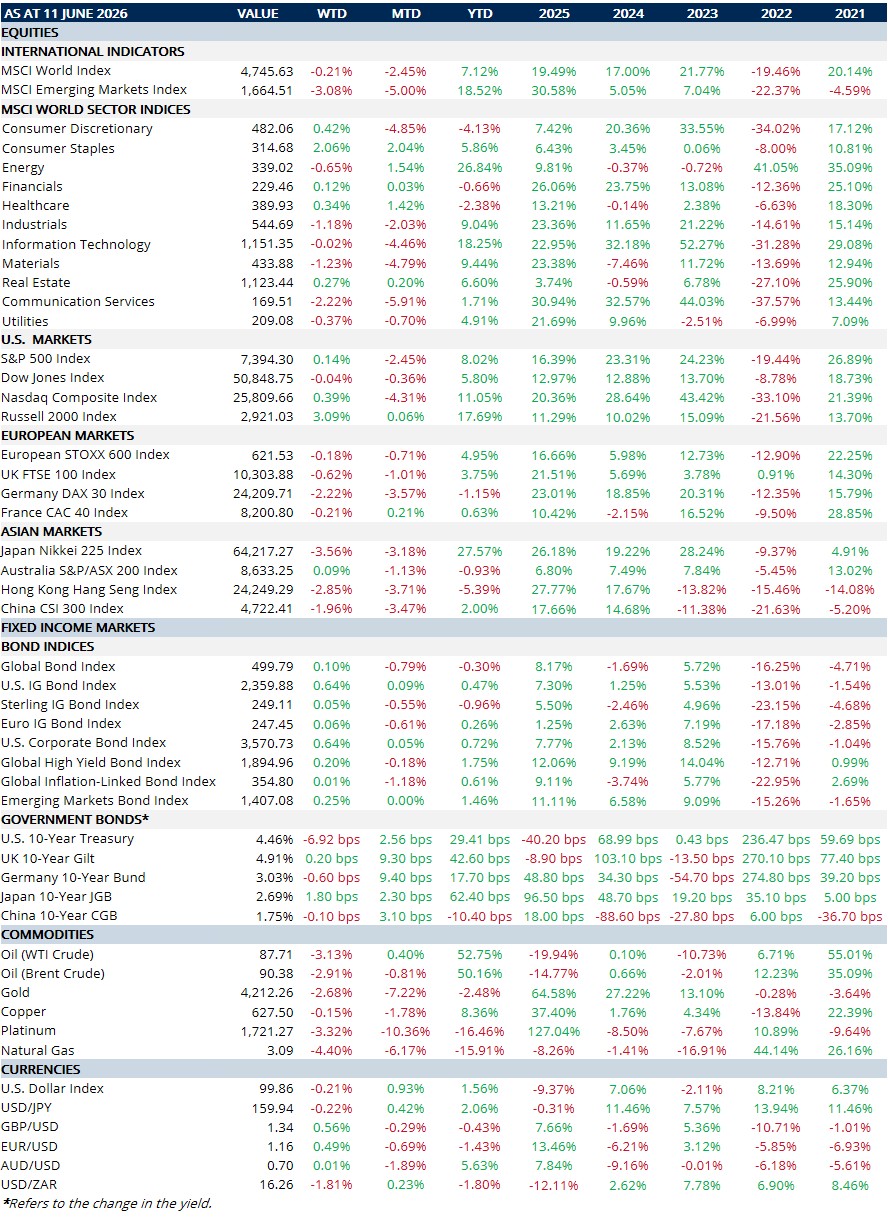
MARKET SUMMARY...
- Credit spreads were largely stable (despite heightened volatility in equities).
- Chip stocks came under pressure.
- Inflation prints add further, upward pricing pressure.
- The ECB raised rates +0.25% in its June meeting.
- Newly-appointed Fed Chair Kevin Warsh is likely to raise rates too……
- ……as is the BoJ (to take it to 1%). The equilibrium rate (R*) is perceived to be 2% – so some way off!
- UK April GDP released this morning declined -0.1% m/m, driven entirely by a decline in services (-0.2% m/m); production was flat, construction rose modestly.