Half-way mark……what are the tea leaves telling us?
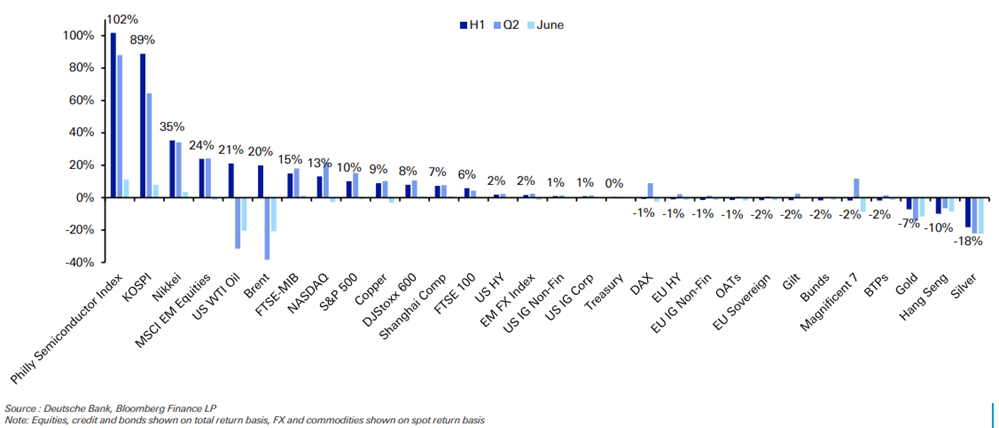
Half-way through the year and, given all that has gone on, how do things stack up? The chart below shows the US$-based performance for select, financial assets ranked by YTD:
Highlights:
- Geopolitical events continue to dominate as markets display see-saw action on deal one minute and then no deal the next (more on this later).
- Oil has slumped and, at the time of writing this, WTI is around $68 pb while Brent is around $71 pb. Both are back at pre-war levels. Over Q2 alone, Q2 saw the biggest decline (since the 2020 pandemic) of -38.4%.
- Despite the current turmoil in Tech, chip stocks have seen a bonanza. The Philly Semiconductor index has risen +88%. YTD stands at +101.7%. The Mag-7 stocks are down just under -2%, underperforming UK gilts. Even they can’t compete with AI. Crazy stuff!
- While the tech turmoil has spilled over into EM – notably the tech-heavy Korean index (KOSPI) – the latter has nevertheless risen +64.3% over Q2.
- Japan’s Nikkei rose +34.1% over Q2 – its best quarter since Q1 1986!
- Still on Japan – the Yen seems to be cratering – in spite of the country’s Central Bank (BoJ) raising rates +0.25%. It is hovering around 161.50 to 162. However, this is as much a US$ strengthening story as a Yen weakening one (see below).
- New Fed Governor – Kevin Warsh – kept rates unchanged. This was expected – but consensus points to him tightening. However, that’s not clear-cut (see below).
- EuroZone (EZ) June CPI (inflation) slowed to 2.8% y/y (previously 3.2% y/y). The print was 0.20% better-than-expected; Core CPI slowed to 2.4% y/y (previously 2.6% y/y) and this was 0.10% better-than-expected.
- The chart also shows how precious metals (Gold and Silver) continued to get battered. Over Q2, Gold fell -14.1% and Silver fell -22.0%. This brings to an end five, consecutive quarterly gains. YTD, Gold is now down -7.2% while Silver is down -18.2%.
Where does all this leave us?
The current geopolitical stance gives the key players (US, Israel and Iran) a rest-bite. As I wrote a couple of weeks ago, this is a strategic pause allowing (1) the US to gear up for the mid-term elections, (2) an opportunity to rebuild depleted oil reserves (US and China), (3) an opportunity for Israel to take a breather ahead of their October elections while also rebuilding missile defences and (4) put a brake on (at least slow down) rising inflation. In return, the price “paid” is to give Iran free access to sell its oil – which it is doing at a premium vs pre-war. I sense renewed trouble post the mid terms in what will be Trump’s remaining two years in office. This keeps upward pressure on inflation.
Gas prices at US pumps have dropped sharply & quickly. For context, they started the year at a low of $2.81 pg (per gallon), shot up to $4.55 pg (peak) and have now dropped back to $3.85 pg. What this means in terms of filling up both standard-size and large-size vehicle tanks is that the cost is still +37% higher for both. By contrast, grocery shopping continues to rise by some +3% pa. However, this is far from uniform. Wheat prices are nearly +15% higher (due to declining crop output) which will undoubtedly affect items like bread and cereal. Over this same period, generic polling ballots show while the Democrats had only a slight lead back in January – it now stands at some +7% over the Republicans.
Stagflation fears have receded significantly. The latest Bloomberg consensus shows the probability of a recession at 25%; the market-implied probability is 12% while the Goldman Sachs estimate stands at 15%. It’s worth highlighting the Bloomberg consensus has always been far higher than the other two by some margin! This has boosted equities and bonds helping them to recover. Latest data shows global market implied ERP (Equity Risk Premia) ranging from 2.8% (Japan) to 5.4% (Asia Pacific ex-Japan). Globally, it stands at 3.3% (vs the US’ 3.0%). The US’ was lower pre-war.
Can the tech bonanza continue?
In short, Yes! AI will have a meaningful impact on productivity growth over the coming years (something newly-appointed Fed Chair Warsh is keeping a close eye on – see point 5 below). The key question for markets, macro and equities is when and in what areas will it become apparent? A Goldmans study looked at the Information and Communications Technology (ICT) revolution from 1980 to 2000. They found the path from tech innovation to broad-based productivity was not fast or uniform. It arrived 15 years after the commercialisation of the PC. So can the same be said of AI? Hardly! In fact we’re seeing its use already becoming viral as users start to understand how and where to use it more efficiently. The only impediment to its adoption will be human intervention – and even here we’re speaking of delays, not abandonments. Currently, investment in hardware is moving at a rapid pace while the reorganisation of workflows is slower. The latter will pick up pace once users start to gain more experience…..and this will become apparent when more and more job adverts start to seek those with expertise in its use across various segments of industry. Improving economies of scale are also a big factor in enhancing productivity.
Where does Kevin Warsh stand on rates – is he secretly a bull or simply a pragmatist?
Currently, market pricing (based on the 30-day Fed Fund futures) is implying rate rises ahead – but nothing significant (around +0.25% by year-end). However, it’s not so clear cut. In a panel discussion on Wednesday, he said “inflation expectations have come down and that inflation risks have come down” and that if AI causes the supply side to expand, “that has huge implications for monetary policy”. He also suggested large changes could come out of the task forces he set up (announced at the June FOMC). He expects to be able to make greater use of real-time data over the next 9m to 12m and hinted the “Fed dot-plot” could be phased out. So – despite market-implied expectations of a further hike by year-end – given the close eye Warsh is keeping on AI and its impact on the labour force & productivity, rates are more likely to remain unchanged. This is a further boost to equities.
Where to for the US$ – is the US$ debasement trade over?
The US$ Trade-Weighted Index is holding over 100 (see table below) and the US$ has risen nearly +3% YTD. Wasn’t the Trumpian supposed to be game-over for the US$? Why is the US$ rising again? There are several reasons:
- The first is that it is partly cyclical – you only need to look at a US$ TWI chart to see that. It is not an uncommon pattern comprising Risk-on, Risk-off!
- US productivity has resumed its outperformance in recent years vs the rest of the G7, especially since covid.
- The US now accounts for almost half of global equity market capitalisation even though US GDP is around 25% of global GDP and a mere 4.5% of the world’s population.
- US private AI investment has reached almost $300bn – nearly 20X more than its closest rival, China.
- It remains dominant as a share of disclosed central bank reserves (almost 60%) and as a share of global transactions and trade (some 60% to 90%).
Despite global efforts to debase it, the US$’s lead comes down to massive, highly liquid credit markets (Treasuries), stable legal institutions and trusted capital markets. It’s not all rosy though – the sheer size of the US deficit is costing more to service than its defence budget as a percentage of GDP. It comes down to a trade-off between GDP vs deficit. All said and done, corporate / enterprise culture remains rich and creative.
Japan’s Yen is now at a four-decade low to the US$ while JGB yields are at three-decade highs.
The Ministry of Finance (MOF) has intervened to the tune of nearly Yen12tn (over $72bn) to try and prop up the Yen just in the period from 28th April to 27th May (a mere 1 month) only for the Yen to then start sliding further. The Yen has fallen -37% since the start of 2021 and -53% since the start of 2012. The dilemma for the government is imported inflation especially fuels, foods and consumer products. The government spends money in the form of subsidies to limit price hikes. Meanwhile, with JGB yields rising so far and fast (10y = 2.77%; 30y = 4.03%), the cost of government borrowing is rising too. The BoJ is trying to limit the fall in the Yen through Quantitative Tightening (QT) – the effect of which is to drive up yields and raise rates. It presents the Government and the BoJ with a conundrum – the BoJ has to watch monetary policy while the Government has to watch fiscal policy. The likelihood is that the BoJ will have to raise rates even quicker – at the moment it is being too slow. However, too quick is dangerous for households and companies when it comes to their interest servicing costs. On the other hand, a weak/falling Yen hurts importers through higher prices.
What happens to Gold from here?
A JPM report forecasts a price target of $6,000/oz by Q4 2026 and then $6,300/oz by 2027! This might come as a surprise to many but they are not alone. Wells Fargo has a year-end target of $6,100 to $6,300/oz; Bank of America (BoA) says $6,000/oz with an extreme-demand target of $8,000/oz by 2027 if structural deficits worsen! UBS and DB are saying $4,500/oz and $4,950/oz respectively. Goldmans trimmed its forecast to $4,900/oz (from $5,400/oz). However, if we start by asking why gold has fallen so much, the answers are threefold: inflation, interest rates and a stable US$. All three are anathema to gold. A big driver has been central bank buying and there have been suggestions this has been cooling. Actually, evidence shows this is not the case – a certain amount of gold purchases go unreported (World Gold Council). In Q1 this year, some 244 tons of gold was purchased, supposedly by China. So, understanding the case for gold requires an understanding why central banks are buying – and the answer to the latter seems to be strategic having seen the consequences of freezing US$ assets belonging to Russia and Iran. Chinese buying also seems to be tied in with its strategy of establishing the Renminbi as a credible reserve currency alternative. It has previously touted the idea of using gold as collateral. Furthermore, in early 2025, China’s top 10 insurance companies received regulatory approval to allocate up to 1% of their AuM (Assets under Management) to physical gold. Imagine if this cap starts to steadily increase! Then there’s the other trigger as cited by BoA: structural deficits. The GDP rates needed in the Western world to stay commensurate with the growth in debt is simply unsustainable.
To sum up
It’s going to be an interesting 2nd half. In the following order we have: (1) the World Cup knockouts, (2) the summer holidays and then (3) elections in Israel followed immediately by the US mid-terms. After that, I suspect the Middle East should flare up again upon which yields and (perhaps to a lesser extent) inflation should resume their upward trajectory. Don’t rule out a market melt-down!
MARKET SUMMARY…
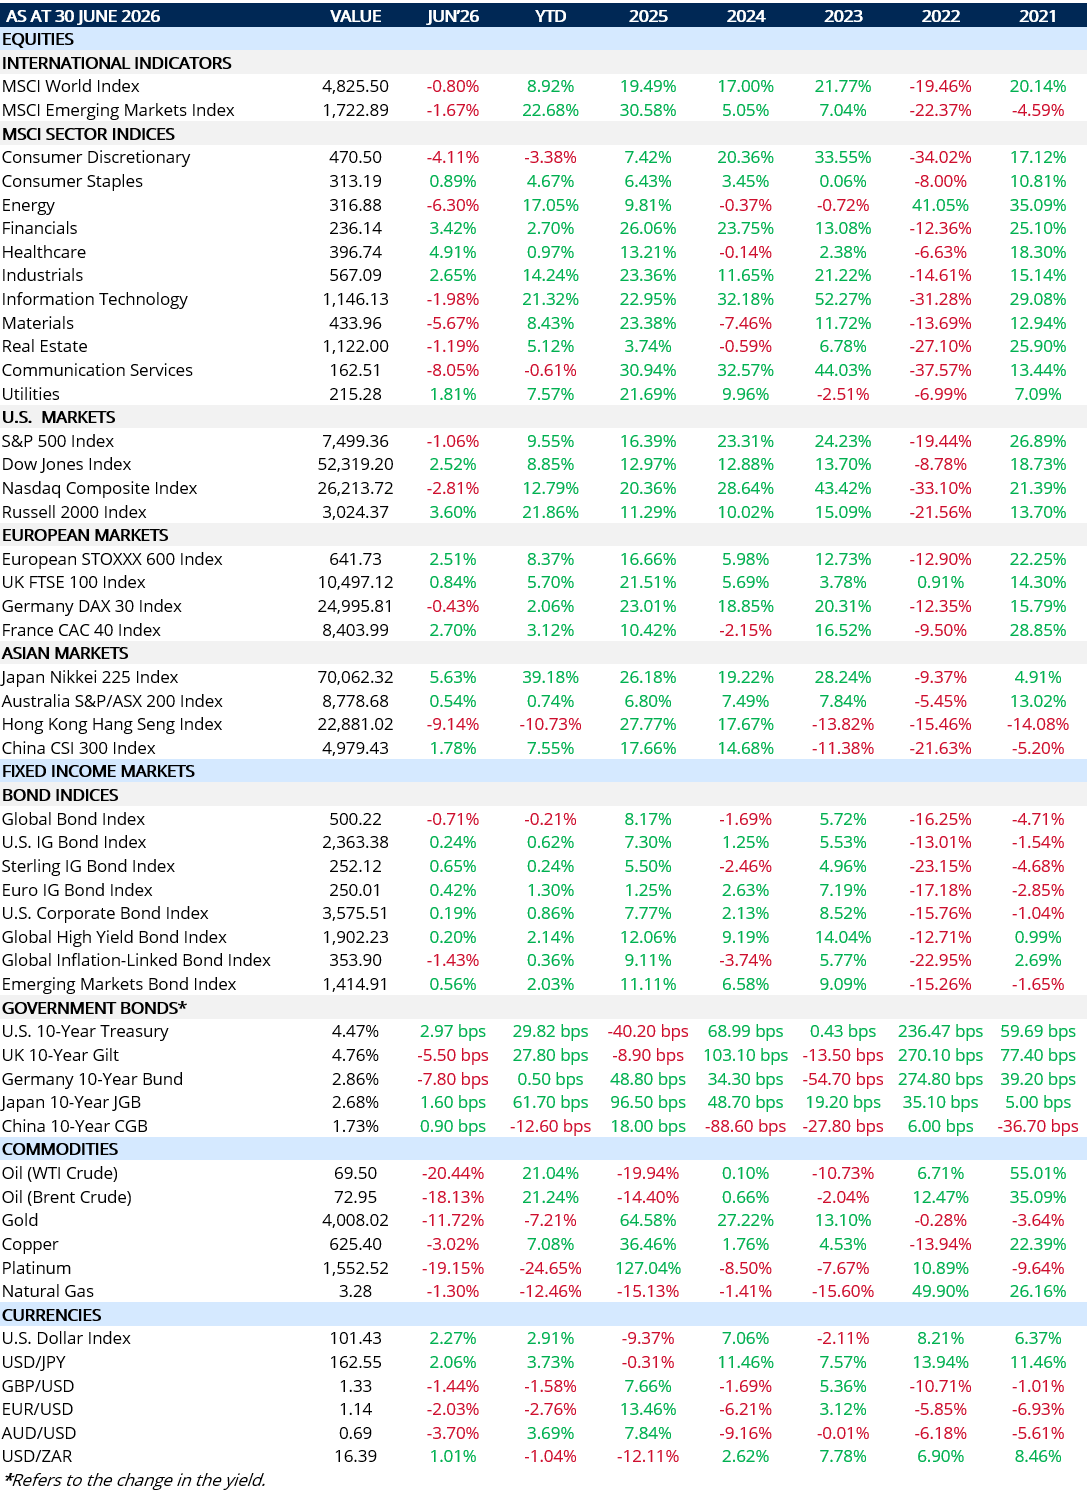
June’s Nonfarm payrolls increased by a much-less-than-expected +57,000. May’s figure was revised down to +129,000 (-43,000) and April’s figure was revised down to 148,000 (-31,000). The unemployment rate dropped to 4.2%. The print was largely due to a slump in the labour force participation rate which fell to 61.3% (-0.3%). Professional and business services contributed the most gain. Earnings gained +0.3% m/m to 3.5% y/y. This presents a stable picture and we have had lower-than-expected prints before only to bounce back in later months. Critically, initial jobless claims remain steady at 215,000. The latter is more of a leading indicator and remains consistently steady and low.
It has been a good week for the US$ aided by rate hike expectations and a more stable assets outlook (on the back of a cautious truce in the Middle East).