My weekly of 31st July focused on how investors are reassessing the AI investment cycle with the key question being can hyperscalers monetise AI quickly enough to justify the current vast expenditure with a focus on Free Cash Flow, Earnings & Valuations? This led to a severe market correction in July. The conclusion was yes, projected growth rates could accommodate the earnings cycle and therefore valuations…..subject to expanding market share. However, a major threat exists from cheaper competitors, especially China, which would likely affect the cost/benefit approach.
This week, the focus is on the cost itself. The table below is a comparison of different providers (source: Artificial Analysis). It compares the blended cost of different LLMs and highlights the vastly cheaper Chinese competitors, DeepSeek and Kimi – both of which are open-weight models (i.e. their model weights are publicly available allowing others to download, run and adapt them). This is not the case for the others.
| Model | Provider | Blended $price / 1m tokens | Artificial Analysis Intelligence Index (AAII) | What you’re getting |
| DeepSeek V4 Flash Max Reasoning | DeepSeek | $0.06 | 40 | Very low-cost reasoning; text-only; open weights |
| Gemini 3.5 Flash-Lite | $0.33 | 36 | Low-cost multimodal model; exceptionally fast | |
| Claude 4.5 Haiku | Anthropic | $0.77 | — | Lower-cost Claude; text/image |
| Gemini 3.6 Flash High | $1.16 | 50 | Strong reasoning + multimodal capability | |
| Grok 4.5 High | xAI | $1.35 | 54 | High-end reasoning; text/image |
| Kimi K3 | Moonshot AI | $2.31 | — | Chinese open-weight reasoning model; text/image |
| Claude Opus 5 Max | Anthropic | $3.85 | 61 | Current AA intelligence leader; premium model |
| GPT-5.6 Sol Max | OpenAI | $4.35 | 59 | Frontier reasoning; multimodal; 1m context |
| Claude Fable 5 Max/Fallback | Anthropic | $7.70 | 60 | Extremely capable but particularly expensive |
However, before proceeding, here’s a key primer/ jargon-buster to explain in plain English (I hope!) how these comparisons are arrived at and what exactly we are comparing:
| LLM Economics | What does it mean? |
| AI USAGE | This is what you ask the model to process and produce. |
| ↓ (leads to) | |
| TOKENS | This is the unit of measurement. Usage is measured as INPUT (what you send the model e.g. questions, attachments, instructions) + OUTPUT (the response generated) + CACHE(previously processed input that can be reused more cheaply). |
| ↓ | |
| BLENDED API / INFERENCE PRICE | What YOU pay to use the model. It is normally expressed as $ per 1m blended (ratio of INPUT:OUTPUT:CACHE) tokens. This is what the $0.06 DeepSeek vs $4.35 GPT table above is referring to. |
| LESS: ↓ | |
| INFERENCE COST | What DeepSeek/OpenAI pays to provide the service: Compute + Memory + Electricity + Data-centre/Hardware + Networking/Servicing. |
| ↓ | |
| GROSS PROFIT CONTRIBUTION | Price less Cost. What remains to the LLM provider BEFORE its other operating costs. |
| ↓ | |
| OTHER COSTS | R&D/model development, staff, S&M, administration, etc. |
| ↓ | |
| OPERATING PROFIT | What ultimately matters to the provider’s earnings! |
On current scoring (i.e. AA’s Intelligence Index), GPT = 59 vs DeepSeek = 40. What does that mean? By aggregating some 9 “frontier evaluations”, GPT excels in (1) autonomy, complex maths and hard coding logic; (2) logic, scientific reasoning and agentic workflows and (3) successfully completes more tasks without failing/hallucinating! Even on this basis, it’s quite revealing: DeepSeek scores 40 at $0.06 vs GPT’s 59 on $4.35. In other words, even though GPT scores 48% higher on AA’s Intelligence Index, it’s blended API price is 72.5X more!! Suppose tomorrow, DeepSeek jumps from 40 à 59 with a doubling or tripling in its blended API price (i.e. $0.12 or $0.18). It would still have a massive pricing advantage! This is where the difficulty lies – there is simply no linear measure of economic usefulness; it’s very much exponential and can swing both ways to either’s advantage, but, right now, the cards are stacked in DeepSeek’s favour.
So, with the above as context, what proof exists in terms of market share? OpenRouter’s June 2026 analysis covered over 450 trillion tokens from 1st January to 14th June this year! It’s a highly significant survey and showed DeepSeek’s share of the token market DOUBLED in 6 months (from 9% to 18%). This was roughly maintained by mid-July. At 18%, the likely impact on OpenAI (GPT) revenue & margins is limited. However, at say 25%, there’s a pinch being felt. At 35%we would see material margin compression for OpenAI. Anything higher than this and OpenAI’s economics would fundamentally deteriorate.
This is why market share (and specifically growth rates in revenue and earnings) becomes critical! Suppose a Chinese open-weight LLM can provide a good result for a normalised blended API price of say $0.10 per 1m blended tokens. Then the incumbent faces three possibilities:
- Maintain its price at $1 à in which case it will lose volume/share.
- Cut its price towards $0.10 à in which case its Gross Margin collapses unless its own inference costs fall in an equivalent manner (which is not impossible!).
- Demonstrate its model is superior/sufficiently better to command such a premium….and this is what the market is asking of OpenAI, Anthropic, Google and others to prove as reflected in July’s market price action!
This is where the second derivative comes into play: falling inference prices are potentially bad for AI-provider pricing power BUT enormously positive for AI demand. Let’s say inference prices fell 90%, applications that were previously uneconomic suddenly become viable resulting in increased AI demand. The transmission then becomes: Inference price falls à Higher AI adoption à Higher token consumption àHigher compute demand. So, trying to tie in all the above with 31st July’s revenue/earnings projections, what might the impact look like on semiconductor earnings over the next 5 years for different adoption rates?
| Scenario / API Price Change | Illustrative Token Usage | Implied Revenue Growth | Revenue CAGR | Token Growth Required for 25% Revenue CAGR | Token Growth Required for 40% Revenue CAGR | Likely Earnings Impact |
| High-price / -25% | 3X | 2.25X | 18% pa | 4.1X | 7.2X | Positive, but below previous revenue forecast |
| Base / -50% | 5X | 2.50X | 20% pa | 6.1X | 10.8X | Strong if inference costs fall sufficiently |
Cheap AI / -75% |
10X | 2.50X | 20% pa | 12.2X | 21.5X | Strong revenue; margins become critical |
| Ultra-cheap AI / -90% | 20X | 2.00X | 15% pa | 30.5X | 53.8X | Huge usage; earnings uncertain |
| Price war / -90% | 5X | 0.50X | -13% pa | 30.5X | 53.8X | Very negative |
- Falling API prices do place a(n enormous) burden on volume growth; if prices halve, token consumption needs to increase some 6X just to stay with the lower end (25% pa) revenue-growth projection and almost 11X to achieve the top end (40% pa).
- If prices fall 75%, those figures become 12X and 22X respectively.
The token growth required to sustain the current, high earnings growth, doesn’t strike me as unachievable – and speaks directly to the heart of the current AI usage evolution. In fact, given where we are in the AI cycle, it seems very achievable. While growth in the order of 50X or more is presented as an outlier in the above table, I think that’s ultimately where we’re headed once AI’s full potential and capability becomes apparent. The critical question for semiconductor earnings is therefore whether growth in AI usage EXCEEDS the reduction in compute required per unit of inference? One known unknown is geopolitics: Australia recently banned DeepSeek from use in its federal government systems while other governments have imposed public-sector restrictions too. Then there’s the fragile US-China relationship.
Who wins? It isn’t simply about being “cheap”. It comes down to Price x Capability x Usage x Margin x Geopolitics. If inference prices collapse, LLM providers will most likely face pricing/margin pressure; AI applications will most likely experience much greater economic viability; consumers and companies will likely enjoy cheaper intelligence and productivity; semiconductors will likely see a very positive impact where usage growth exceeds compute-efficiency gains and the world of robotics/physical AI will likely see massive transformation.
ECONOMIC & MARKET SUMMARY…
- US July CPI inflation was released on Wednesday. It was benign enough to reduce pressure for a September rate hike. The headline rate rose 0.1% m/m to 3.4% y/y; the core rate rose 0.2% m/m to 2.5% y/y. Market reaction lowered the implied probability of a September rate hike; the 10y Treasury rated eased to 4.65% on the print.
- US July PPI inflation was on Thursday. These also pointed to a soft, cooling trend in the upstream portion of the supply chain helping to reinforce the broader disinflation narrative.
- Both prints strengthened Fed Chair Kevin Warsh’s “leave it to the markets” argument. Meanwhile, the “communication debate” rages on.
- UK GDP proved resilient in Q2 growing a total of 0.4% q/q (above the BoE’s forecast). It was led by household consumption (+0.3% q/q vs Q1’s +0.6% q/q) and business investment. Net exports were neutral while government spending turned negative.
- Japanese July PPI inflation decelerated quite noticeably to 7.2% y/y (7.4% y/y had been expected) rising just 0.1% on the month.
- China’s July CPI inflation slowed sharply to 0.5% y/y (vs June: 1.0% y/y). 0.8% y/y was the forecast so this was well below expectation. The weakening macro trajectory is putting pressure on the PBoC.
- India’s July CPI inflation saw food inflation surge to 5.52% y/y which sent the overall index higher. There was some moderation in the W(Wholesale)PI inflation which is still running at close to 10% y/y.
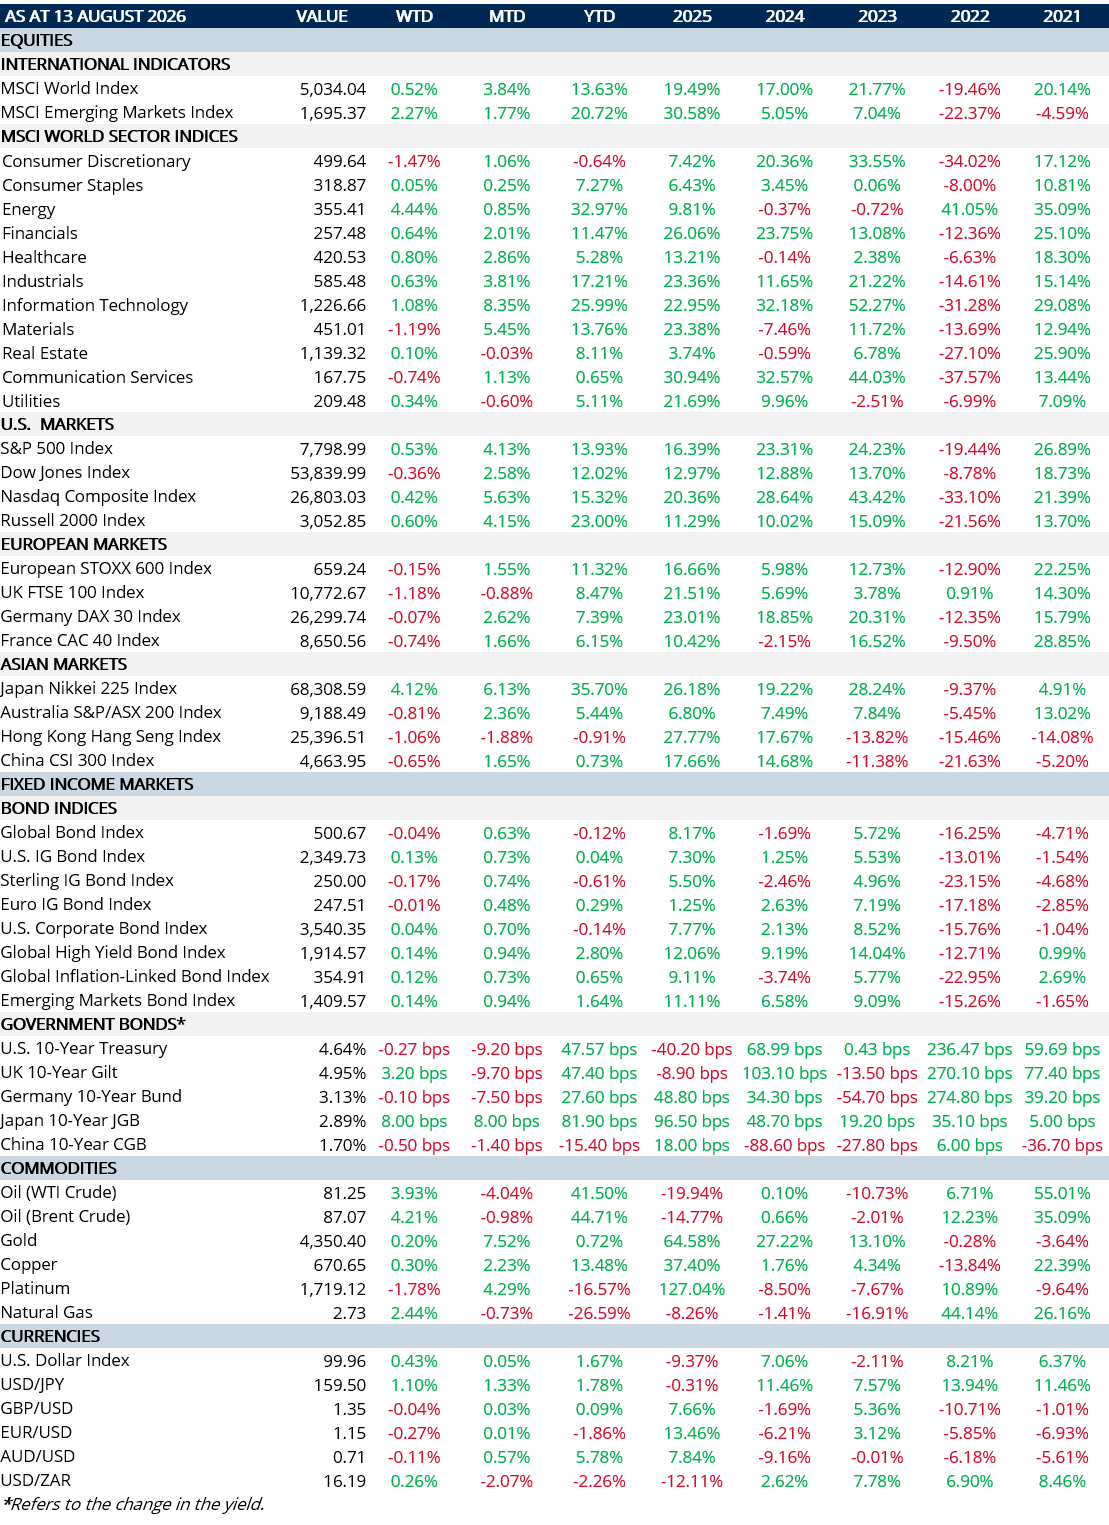
- Market price action saw some rebound in Tech focused largely in EM. US 30y Treasury issuance saw a higher premium demanded for yields as energy climbed on the week.