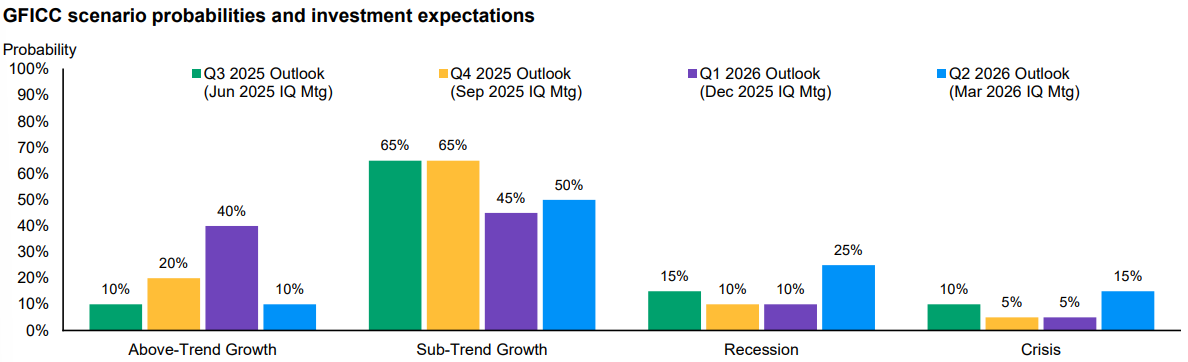
No major changes to the probabilities I cited last week: the most likely scenario still results in a framework deal (50% to 55%) as negotiations continue while the US maintains pressure. Some Gulf Arab and European leaders believe a US-Iran peace deal will take about 6 months to be agreed. This fits the 2nd scenario (see below). If correct, this will require an extension to the existing ceasefire. Meanwhile, Israel has agreed a truce in Lebanon. We still await more information on the latter – in particular whether Hezbollah is signed up to it. There are mounting concerns over rising food prices unless Hormuz is reopened.
- US is trying to cut off Iran’s oil (to increase economic pain) and so raise the urgency for Iran to come back to the table. The blockade is now part of the negotiations. Events have moved from a simple ceasefire negotiation à coercive diplomacy via escalation.
- Iran is exercising patience – for now. It is neither backing down nor trying to break the blockade militarily. Its response is in three parts: (1) Circumvention through alternative ports, rerouting shipments and deploying “dark ships” (i.e. a lot of Iranian ships spend long periods without broadcasting their automated position signals thereby obscuring cargo movements. This means tracking Iranian oil cargoes using these signals will always underestimate flows); (2) Practising strategic patience i.e. avoid rushing into escalation and instead let economic pressure build while testing the US’s will to sustain the blockade and (3) Continue threatening to use escalation as leverage. The latter is its strongest leverage…..only when it feels it is being systematically neutralised (right down to its own economic survival) will escalation become its next and only move.
During the current, non-escalation phase, oil is still trading in a “risk-premium-without-disruption” regime. Brent Oil is still close to $100 pb. A point easily missed is that oil prices can remain elevated even without escalation because risk premium is a function of many other factors (refinery capacity, shipping costs, insurance costs, damaged infrastructure and more).
A quick guide:
- Under “normal” circumstances, the risk premium is around $0 to $5 pb.
- In the current non-escalation phase, it’s around $10 to $20 pb.
- In pre-escalation stress, that jumps to $20 to $40 pb.
- In a crisis, it soars to $40 to $80 pb!
There has been much press attention commenting on the Saudi and UAE cross-country pipelines. These are not a panacea! I’m afraid they only change the ceiling oil prices reach – not the baseline – by dampening these extreme spikes. They do not materially lower oil prices as evident in the current non-escalation phase. It’s important to understand – in market terms – these pipelines provide an alternative re-routing thus helping to reduce the worst-case, supply shock.
They do not add to supply. Hence, they are very unlikely to change the base case oil price ($90 to $100 pb). Only a successful outcome to these talks can accomplish that.
Otherwise, capacity remains insufficient: Hormuz oil flow is around 20mb/d while the bypass pipelines help ease this by about 4mb/d to 8mb/d. This still leaves a large, structural gap…..it’s all about the risk premium!
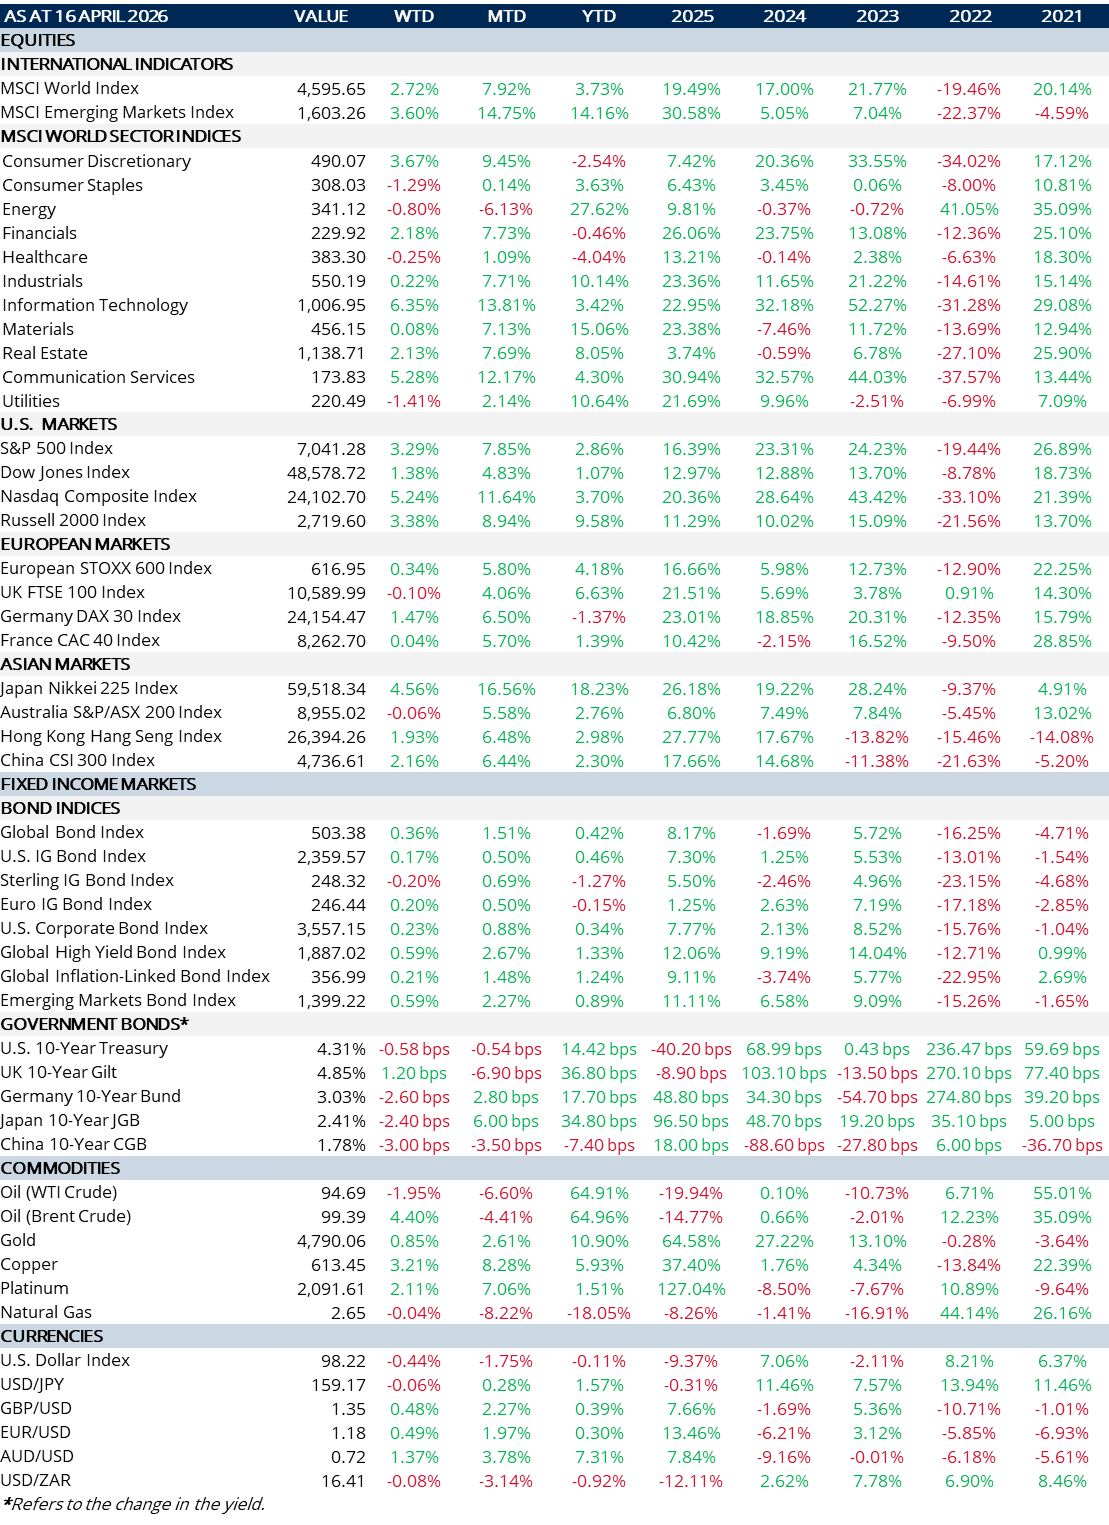
Given all the goings on since 27th February, Risk-On is (almost) back in full swing. Markets are betting on optimism a US-Iran ceasefire extension will be secured through a return to the negotiating table. The S&P 500 has surged past 7,000 (latest this morning: 7,041), setting a new record. The pace of this rally is remarkable and even beats the “Liberation Day” bounce-back. Risk assets have rallied on news of the ceasefire and the ongoing peace talks. A (large) part of the latter is in the belief oil prices will decline further thereby dampening the probability of a stagflationary shock. Recent macro data has strengthened this belief (e.g. latest US payrolls).
Latest probabilities of a permanent US/Iran peace deal stand at 59% by end of May and 72% by end of June. Critically, return to normal Hormuz traffic is rated at 60% (end-May) and 72% (end-June).
Overly optimistic? Perhaps! Observable traffic through Hormuz (Bloomberg Tracker) shows ship-crossings are down -102 since the start of this war (27th Feb). This represents even fewer crossings just in the last few days!
Impact on Cross-Asset Performance/Correlations?
It’s playbook stuff: Energy Shock à Risk-Off à Cross Asset Correlations Spike à Very Few Assets Provided Diversification à Only Energy Held Up. Then came the big reversal (ceasefire). The CORE driver that drove the initial move was inflation, NOT growth.
Now, it’s all about the SECONDARY driver:
Growth. The table below looks at the estimated impact on Growth for different scenarios. Growth is key and its outcome depends on the prevailing oil price regime.
The lag time between the oil price reaching the targets shown below and its impact on the economy (Growth) is crucial: politicians respond to real-economy pain, not spot prices! Brent is close to $100 pb (this morning: $96 pb). It’s the principal reason talks can’t afford to drag on! Latest probabilities have (1) shifted to sub-trend growth and (2) to even weaker outcomes:
Some context to the table below:
- In the first scenario ($80 to $90): the Growth impact is minimal and takes 1 to 2 months to be felt.
- In the second scenario ($100): it can take 3 to 6 months to affect Growth – but the impact is material.
- In the third scenario ($115+): it takes just 2 to 4 months to be felt and carries risk of recession.
| Oil Scenario (Brent) | Global Growth Impact (by Region) | Equities | Credit | Rates / Bonds | Commodities | Correlations / Regime |
| $80–90 (De-escalation / reopening) |
Global: 2.8% to 3.1% US: Mild slowdown; resilient (2.0% to 2.3%) Europe: Strongest rebound (1.2% to 1.6%) UK: Strongest rebound (1.0% to 1.4%) China: Stabilising (4.5% to 5.0%) Japan: Imports relief; real incomes stabilise (1.0% to 1.3%) EM: Importers recover; capital returns; Strong rebound (3.5% to 4.5%) Oil exporters: Slight drag (2.0% to 3.0%) |
Broad rally
Led by cyclicals, tech, EM, momentum, Short-covering |
Spreads tighten HY & EM outperform IG | Yields drift lower Rate cuts back on table; Bonds regain partial hedge role | Energy ↓Metals ↑ (growth recovery) Gold mixed | Correlations FALL Equity – bond diversification returns; Oil loses macro dominance |
| ~$100(Adverse stalemate) |
Global: Oil drags; inflation persists (2.3% to 2.6%) US: Consumer squeezed; Fed on hold (1.4% to 1.8%) Europe: Energy shock; weak industrial base (0.5% to 1.0%) UK: Like EU but more fragile (0.3% to 0.8%) China: Margin pressure; exports soften (4.2% to 4.6%) Japan: Real incomes squeezed (0.5% to 0.9%) EM: Importers under stress; FX ↓ (2.5% to 3.5%) Oil Exporters: Mixed benefit (3.0% to 4.0%) |
Range-bound / choppy
Leadership narrows: Energy, defensives, quality Cyclicals lag |
Spreads widen modestly
HY underperforms IG EM credit weakens |
Messy regime
Inflation > growth initially Bonds unreliable hedge early |
Energy ↑ (supported) Metals ↓ (growth fears) Gold volatile (not clean hedge) | Correlations RISE Equity – credit linkage ↑Equity – bond correlation less negative Oil dominates |
| $115+ (Severe / re-escalation) |
Global: Demand destruction begins; Recession risk (1.8% to 2.2%) US: Sharp slowdown (0.5% to 1.2%) Europe: Most exposed (-0.5% to +0.5%) UK: Weakest of DM (-0.5% to +0.5%) China: External demand & cost shock (3.8% to 4.3%) Japan: Severe import shock (0.0% to 0.50%) EM: Funding crisis (1.5% to 2.5%) Oil Exporters: Dominate if flows stay intact (3.5% to 5.0%) |
Sell-off / de-rating Cyclicals, small caps, EM↓↓Energy & defence outperform (relative, not absolute) | Spreads widen sharply
HY ↓↓, EM vulnerable; Liquidity risk rising |
Two-phase:
1. Inflation shock → bonds sell off 2. Recession → bonds rally (timing critical) |
Energy ↑↑
Metals ↓↓Gold ↑ (later phase, policy stress) |
Correlations SPIKE
Diversification fails; Everything trades off oil / macro stress; USD dominates risk-off |
MARKET SUMMARY...
- Aspirations of a ceasefire extension further boosted Risk-On.
- Equities bolstered across the board – EM and IT were the biggest winners.
- Global bond yields traded lower, modestly amongst Government bonds, strongly among Corporate bonds (IG and HY).
- UK February GDP surprised with a rise of +0.5% m/m (Jan: +0.1% m/m). Contributions were broad-based but dominated by services. Even if March is flat, Q1 should post a decent return. Looking ahead, it’s the higher energy costs and their resulting impact on the consumer, that needs to be watched carefully. It will also impact the BoE’s interest rate decisions.