Week 4: Persistence persists… where do markets stand right? Where could they go?
The war remains ongoing and fully regionalised. There is active fighting across multiple fronts (Israel, Iran, Lebanon, Gulf States). However, at the same time, we have indirect talks and ceasefire proposals circulating. In essence, we have a “dual-track situation” in play with the following developments:
- A short‑term ceasefire pause for 30 days (cooling‑off period)
- A reopening of the Strait of Hormuz with Iran guaranteeing safe passage for all shipping with normal oil flows and global trade restored
- Rolling back Iran’s nuclear programme by dismantling/scaling back key elements of enrichment and a full surrender of nuclear material
- Limits on missile capabilities and drone programmes, reducing their ability to strike Israel and Gulf States
- Curtailed proxy activity (Hezbollah, Iraqi militias & Houthis)
In return, the US has offered sanctions relief and civilian nuclear cooperation. No surprise Iran has rejected these proposals. From what we know, Iran wants reparations, guarantees against future attacks, control/assertion over the Strait and protection for the proxies (especially Hezbollah).
Some 50 000 US troops are already in the region. Up to a further 5 000 marines/sailors and up to 2 000 paratroopers also are to be deployed. While these numbers are a meaningful reinforcement, they do not amount to invasion scale. This speaks to a rapid‑response/escalation force aimed at capabilities around amphibious assault, air strikes, special ops, evacuation, maritime security and limited ground ops – not a full‑scale invasion. The latter would require 100 000 to 300 000 troops, even more.
We are now entering the most critical phase of the war. The shock phase is behind us and we are firmly in the persistence phase. From last week’s table, the persistence phase lasts 2 to 6 weeks – we’re about halfway through. What happens next will determine whether things de‑escalate and return to “normal” or whether they cascade into the “policy friction” stage lasting 2 to 3 months. The table below sets out key market moves since the start of the war (27 February):
| Asset / Indicator | Change Since Start of War | Signal / Interpretation |
|---|---|---|
| Hormuz Ship Transits | -103 ships (or more) | Physical supply disruption |
| Brent Oil | +40% to +50% | Geopolitical risk premium dominating fundamentals |
| US Gasoline (Avg. Spot) | +30%+ | Direct CPI transmission now underway |
| European Gas | +70%+ | Europe remains structurally energy‑exposed |
| Global Equities | -5% to -7% | Growth concerns + early multiple compression |
| US Dollar (DXY) | +2% | Risk‑off + liquidity preference |
| US 10‑Year Yield | +30–50 bps | Inflation expectations rising; term premium rebuilding |
| Gold | Flat / slightly down | Real yields offset safe‑haven demand (for now); Gold is being suppressed by rising yields – NOT through any lack of demand. The fall in the Gold price has followed previous episodes. |
| Silver | Underperforming gold | Industrial demand concerns emerging |
| Investment Grade Credit | +10–20 bps wider | Early stress; still orderly |
| High Yield Credit | +50–100 bps wider | Risk repricing underway; liquidity tightening |
| EM FX / Credit | Weaker | USD strength + external vulnerability |
| Financials (Banks) | Underperforming | Higher yields + credit risk concerns |
| Energy Equities | Outperforming strongly | Direct beneficiary of price + cashflow surge |
| Defence Stocks | Outperforming | Structural re‑rating; policy tailwinds |
| Tech / Software | Rebounding (tactical) | AI narrative paused, not resolved |
Based on the above, what does it tell us about the projected impact on macro and markets? There are so many moving parts to this picture! The table below takes latest projections from different sources (OECD, Reuters, Bloomberg, etc.) of growth and inflation. It then takes a scenario‑based approach to project market reaction using actual and observed market reaction from past events:
| Region | 2026 Growth | 2026 Inflation | Macro Read‑through | Projected Equity Impact (%) | Drivers of Move |
|---|---|---|---|---|---|
| Global | 2.9% | 4.0% | Growth downgrade + inflation shock; risk is to the upside vs the base case. | -5% to -12% | Multiple compression + earnings uncertainty |
| US | 2.0% | 4.2% | Growth resilient, inflation re‑accelerates | -5% to -10% (Index) | Higher yields + valuation compression; however, Energy likely to rise +15% to +30% (direct oil price leverage); Tech -5% to -10% (high beta, multiple sensitivity) |
| Eurozone | 0.8% | Rising | Energy shock + weak demand | -10% to -20% | Earnings downgrade + energy cost squeeze |
| UK | 0.7% | 4.0% | Stagflation‑lite | -10% to -18% | Domestic weakness + rate pressure |
| China | 4.4% | Moderate | Growth stable but exposed | -5% to +5% | Policy support vs external drag |
| Japan | 0.9% | Rising | Imported inflation + policy shift | -5% to +5% | Yen weakness supportive; energy drag negative |
| EM (ex‑China) | 3% to 4% | Higher | USD + energy shock | -10% to -25% | Capital outflows + FX weakness |
The primary driver is the oil shock sensitivity: during the Russia–Ukraine war, oil rose +60% and global equities fell -10% to -25% (peak‑to‑trough); during the Arab Spring, oil rose +30% to +40% and global equities fell -5% to -15%. Rule of thumb: every +20% to +30% move in the oil price equates to a -5% to -10% equity downside.
The resulting inflation shock leads to valuation compression: in 2022, US inflation rose +2% to +3%; the S&P 500 fell -18%. Higher inflation leads to higher yields and lower P/E (valuation) multiples. Rule of thumb: a +0.50% real yield move equates to a -5% to -8% equity valuation impact.
Credit spread widening (a stress indicator) leads equities in stress cycles: High Yield (HY) spread widening of +1% (+100 bps) typically coincides with a -5% to -10% equity downside. So far, we have already had about +50 bps to +100 bps of widening (first table).
Put all the above together: oil +40% to +50%, inflation +1% to +1.5%, yields +30 bps to +50 bps and credit spreads showing early widening mean an implied global equity impact of -5% to -12% (base case) and -15% to -25% (if oil stays >$110 per barrel).
Final thoughts
The above equity market projections apply only if the situation in the Middle East worsens from here. If conditions improve quickly, markets will fly.
There has been a lot of talk about private credit on the back of big names witnessing large redemptions and gating clients. If the above projections play out then, be under no illusion, both public and private markets will incur drawdowns. Investors often like liquid portfolios for the illusion they provide – being able to exit any time. Unfortunately, the reality is quite different – very few actually know what to do with this liquidity.
Not all private credit is born equal. The “problem‑children” have been the long/longer‑duration products where investors are locked up for years, where management teams change every few years and where substantial pools of cash chase a few cash‑hungry investments (e.g. AI/Software). The latter are both highly interest‑rate and valuation‑sensitive sectors. By contrast, the world of short‑duration credit is very different and typically comprises investment transactions that are – by their very nature – self‑liquidating. If you are interested in seeing a report that analyses this in detail, please let me know.
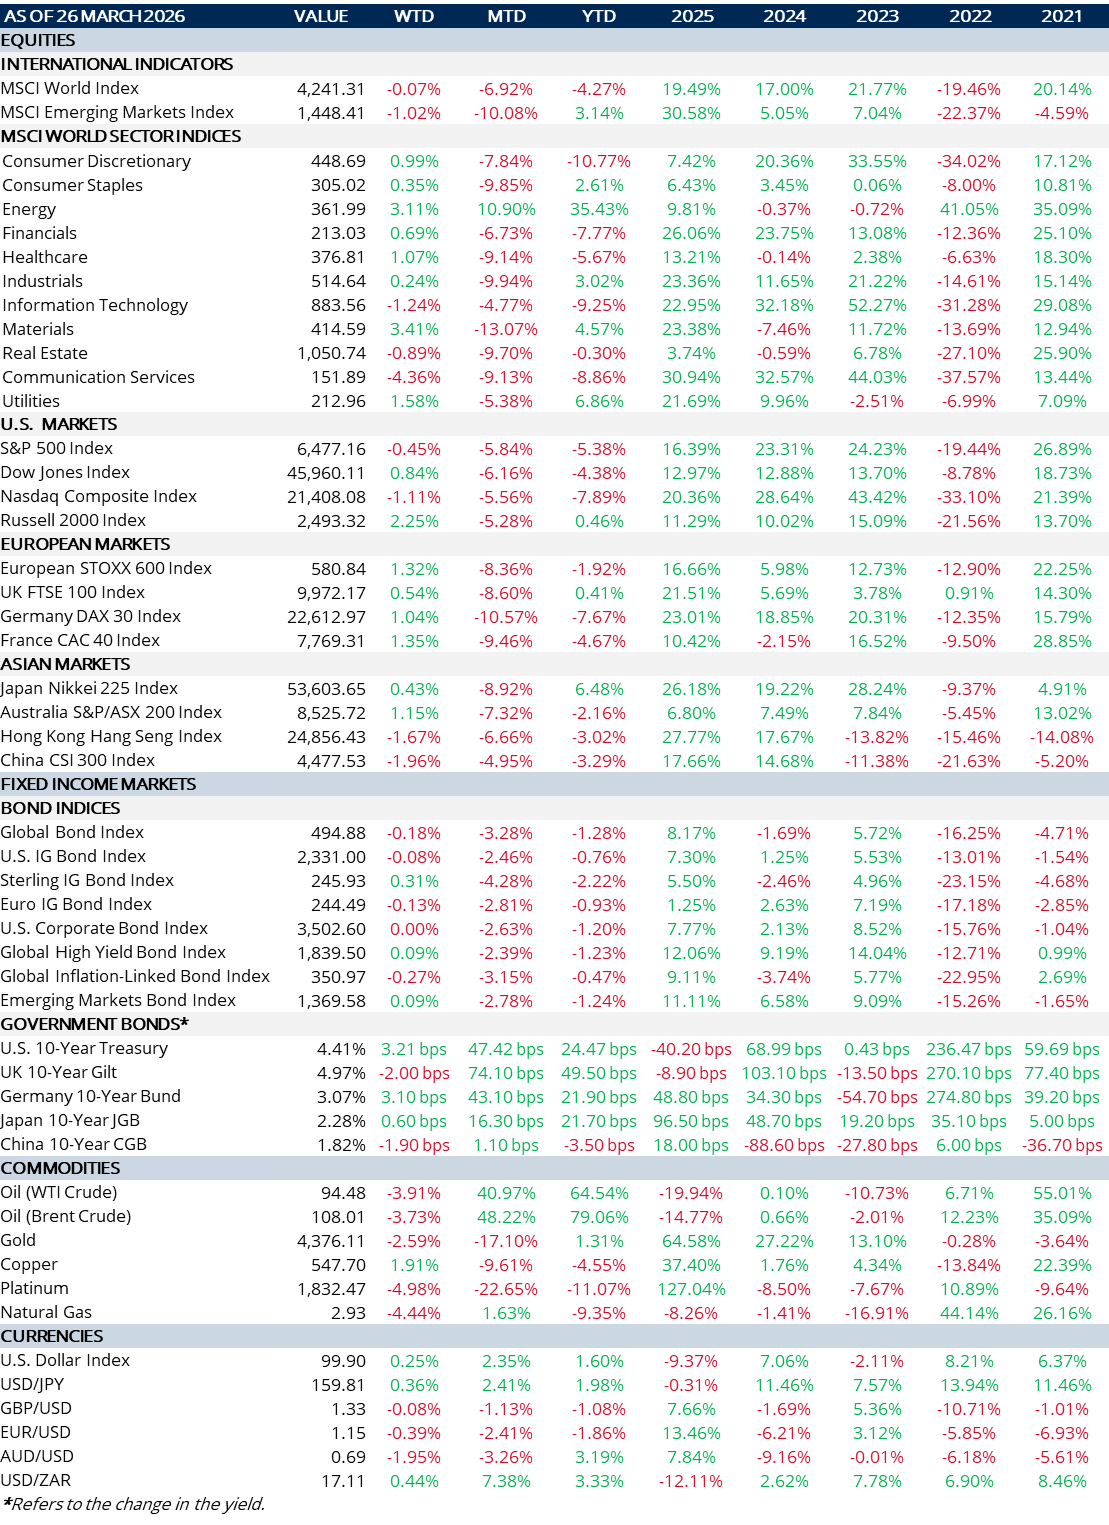
MARKET SUMMARY...
A better week for equities but not by much – energy prices eased off but remain uncomfortably elevated.
By sector, materials and energy led the way.
Market performance is still experiencing gyrations based on news commentary around the war.
Government bond yields were fairly unchanged on the week – but remain painfully high.
On the FX front, the US dollar remains around the 100 mark on a trade‑weighted‑index basis but, interestingly, is not finding support for remaining persistently above this or even climbing higher. This hints to technical factors – not fundamental ones.