Last week the focus was AI take-up and productivity – arguably the most constructive force shaping the 2026 growth outlook and beyond. This vast, technological infrastructure rollout is literally redefining the world we live in and is the single-most important factor shaping the environment. The magnitude of the shift is such that it’s bearing down upon the wider ecosystem e.g. energy.
The next phase of power generation is shifting into space. Why? No regulation to have to worry about, no NIMBY (Not-In-My-Back-Yard) whingers, near-limitless solar power (free from weather disruptions), no real estate limits, free cooling, etc. The task is huge (e.g. thermal and radiation management and launch economics) but I have no doubt both the depth and speed of the advances will be quicker than one might imagine.
A recent example to catch my eye: Japan succeeded in generating solar power in space and wirelessly beaming it back to Earth using microwaves. This moves Space-Based Solar Power (SBSP) from concept to functional technology. From this point onwards, the debate shifts to commercial viability and timelines. Current roadmaps point to a 200MW demonstration as early as 2028, with ambitions extending toward gigawatt-scale systems in the early 2030s. The greater risk may be underestimating how quickly science and engineering compress those timelines. Japan is not alone: the US and China are pursuing parallel initiatives in space re solar capture. There is, quite simply, no limit to what the human mind can do.
So, while AI optimism is real, financing conditions still rule everything where markets are concerned. Markets are doing what they always do at this time of the year – liquidity thins, risk appetite improves (marginally) and optimism ticks up (quietly). The interaction between politics, Central Bankers (CB) and bond markets will be key. There is a growing fault line developing caused by CBs and fiscal dominance. Most CBs will cut rates – the question is to what extent governments attempt to influence them. That’s what we mean by fiscal dominance.
In the US, President Trump’s desire for lower policy rates is understandable in political terms: mortgage affordability has deteriorated, household finances remain stretched and the housing market is a critical transmission channel to voter sentiment. However, the structure of the US mortgage market creates an uncomfortable reality: 30-year mortgage rates are anchored to the long end of the Treasury curve – not to the Fed funds rate. This matters because of inflation credibility – putting pressure on the Fed to ease policy risks becoming counterproductive. If markets begin to question Fed independence and therefore its commitment to price stability, long-dated yields will rise, not fall.
In that scenario, the very outcome policymakers seek (i.e. lower mortgage rates) moves in the opposite direction. It is the yield curve that enforces discipline – not the White House. Until last week, Kevin Hassett was the front-runner for the next Fed Chair job. However, now there seems to have been some pushback to this on the grounds he is seen as too close (a friend) to Trump. Governor Kevin Warsh is now in the reckoning alongside Hassett. Worth remembering that it was Trump who appointed current Fed Chair Powell……and look how much grief Trump has given him! Bond markets are far less forgiving vs the post-GFC (Global Financial Crisis, 2008) era. The scale of global debt (public and private) means that even small changes in yields can – and do – have an outsized effect.
2026 will not be defined by a single, macro outcome. Growth can remain resilient; AI-related investment can support productivity; Fiscal policy can remain expansionary; even inflation can stay stuck aided by external factors (e.g. WTI Oil prices – hovering around $56 per barrel). However, all four cannot coexist indefinitely without some sort of hit to credibility. Markets have never been able to tolerate deficits, inflation and political activism simultaneously – we have seen that this year! Furthermore, markets have become far less patient. So as we go into year-end, seasonal dynamics may well support risk-taking and carry trades (a sign of risk-on); in fact, history even suggests early January begins with a sense of New Year optimism…..but, underneath the surface, major structural questions remain unresolved.
It all comes back to the notorious R* – the neutral (or equilibrium) rate of interest. The latter represents the real interest rate consistent with an economy operating at its full potential (i.e. full employment) with stable inflation (i.e. its target level). For the most part (geopolitical and momentum-driven sentiment aside), this sense of equilibrium is what drives bond markets (yields). The latter determines opportunity cost and, critically, debt-servicing cost. The table below is an attempt at summing up the indicative picture for R* and yield curve valuations in 2026 (and beyond) based only on what we know about policy today:
| Region | Estimated R* (Real) | Implied Nominal Policy Rate (Long-Run) | Yield Curve (now) vs Fair Value | Commentary |
| United States | 2.75%–3.25% (currently: 3.00%-3.50%) | 4.75%–5.25% | Front end: below neutral but converging; Belly of the curve:modestly rich; Long end: materially rich | Markets price further easing and eventual policy restraint. Long-end yields still embed an assumption that fiscal dominance and inflation credibility risks remain contained — an assumption we view as fragile. |
| Eurozone (Core) | 1.75%–2.25% (currently: 1.8%-2.0%) | 3.75%–4.25% | Front end: rich; Belly of the curve:rich; Long end: materially rich | Curve pricing remains anchored to weak-growth narratives and underestimates QT, rising bund supply and fiscal expansion. The spread compression seen in the Peripherals hides core duration risk. |
| Japan | 0.75%–1.25% (currently: 0.75%-1.25%) | 1.5%–2.0% | Front end: near fair value; Belly of the curve: slightly rich; Long end: rich | A genuine regime shift is underway, but markets still assume an implicit ceiling on yields. Further repricing depends on wage persistence and BoJ tolerance for yen strength. |
Footnotes / Methodology
- R* (real neutral rate) The real interest rate consistent with output at potential and inflation at target, absent cyclical stimulus or restraint. Estimates derived from a synthesis of central-bank models (e.g. HLW), market-implied real yields (e.g. TIPS), fiscal arithmetic and structural forces (demographics, capex, debt).
- Implied Nominal Policy Rate (Long-Run) The nominal expression of R*, calculated as: Implied nominal neutral ≈ R* + long-run inflation anchor. Note: This is an equilibrium anchor, not a policy forecast.
- Fair Value Yields (FV) Indicative equilibrium ranges assuming positive term premia in a post-QE world, rising sovereign supply, no financial repression and broadly intact inflation credibility.
- Current ranges shown are market-implied ranges i.e. inferred from traded prices such as interest-rate derivatives (OIS), not the official government target (e.g. Fed 3.50%-3.75%).
The table is simply trying to answer the question: given where neutral rates and term premia sit now, how does today’s yield curve look if we strip out cyclical noise? The answer to this is split between the three segments of a yield curve i.e. its Front-end (typically up to 2 years), it’s “belly” (the middle part, typically over 2y up to 7y) and lastly (and very importantly), the Long-end (10y+). The upshot is that the front-end of the yield curve (YC) remains suppressed by expectations of near-term easing; the belly still has embedded in it an assumption that the low -rate regime eventually returns; however, here’s the danger: the long-end remains anchored to the pre-covid norms we experienced and this is increasingly inconsistent with higher debt, higher R* and less credible policy! While the above is not a call on timing…..it is a structural observation i.e. the longer markets cling to outdated anchors (i.e. the post-GFC assumptions that neutral rates are structurally near zero, long end yields can be suppressed indefinitely and fiscal excesses will self-correct), the greater is the risk of adjustment and the stronger the force with which it will be delivered (whiplash).
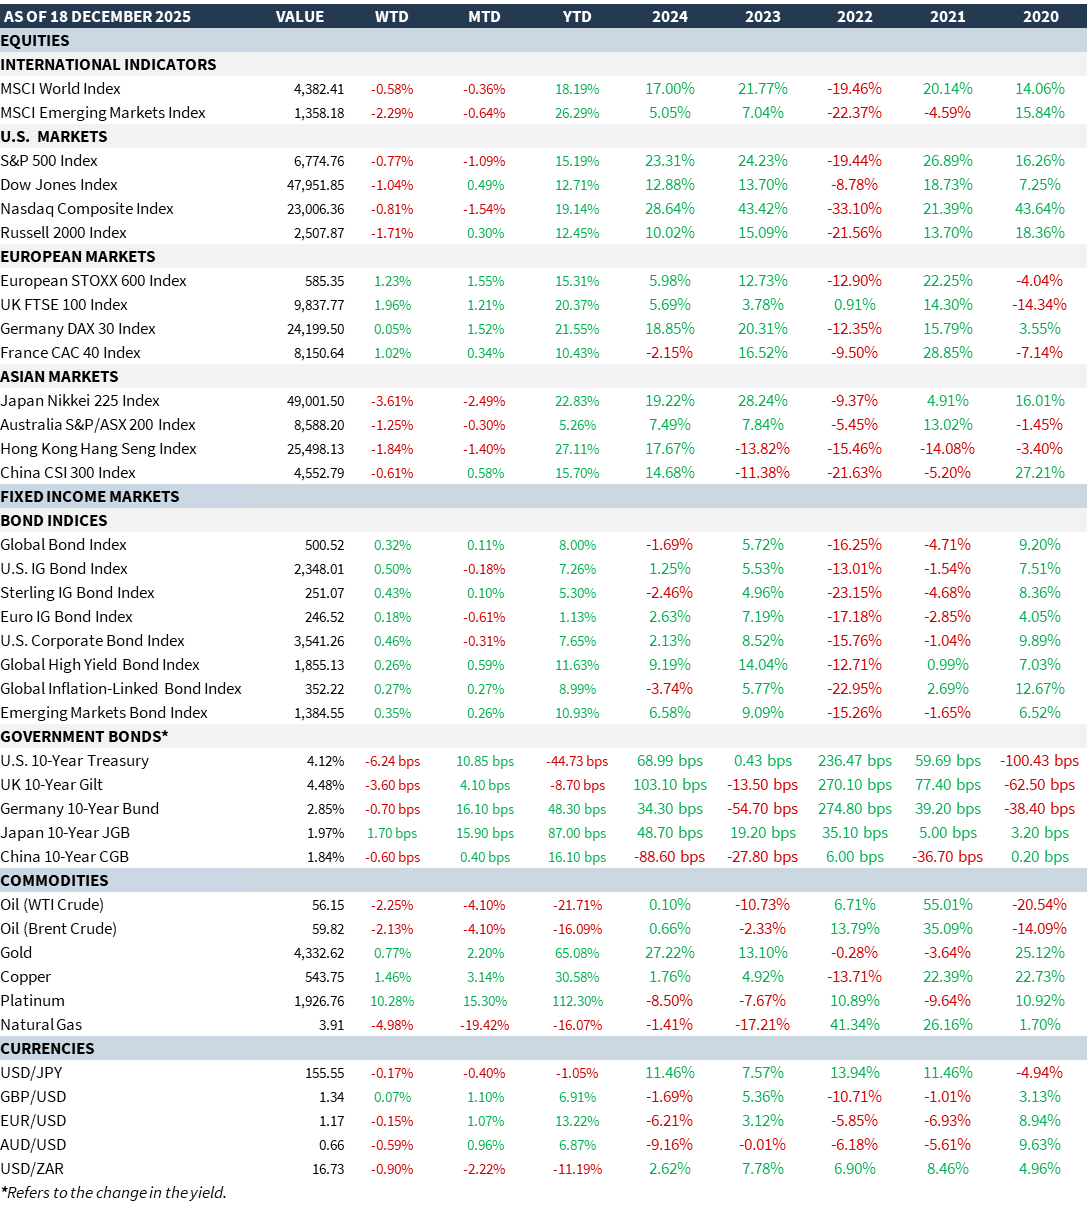
MARKET SUMMARY...