Size doesn’t matter…….it’s the Amplifier, stupid!
The Japanese Yen has been front-paging headlines. The reason? Growing fears of a reversal in the Yen carry trade!
- The carry trade is the practice of borrowing in a currency where interest rates are low (e.g. Yen, approximately 1%), converting those proceeds – via an FX spot trade – into another currency (e.g. US$) and then investing those US$ proceeds into an asset offering a higher return (essentially, anything comfortably over 1% e.g. Treasuries). The investor earns a “carry” i.e. the difference between the cost of borrowing in Yen and the return earned on the investment in US$.
- The main factors affecting the return (the “carry”) are FX movements and interest rate changes for the duration of holding the investment: if rates rise and/or the Yen appreciates in value, it encourages investors to sell those assets and convert the US$ into Yen asap to repay the Yen loan……..and the latter is the bridge to what began last week. So imagine this: you borrowed cheap at say 1%, invested the converted proceeds into something returning 6% to 7% to earn yourself a net of 5% to 6%. Looks great right? Problem is so far this month, the Yen has appreciated some 4% wiping off roughly a year’s prospective carry in one go.
What are the main “borrow” currencies? Yen and Swiss Franc (“Swiss”). Ahead of a much-anticipated rate rise this month, the BoJ (Bank of Japan) policy rate is 1% while the SNB (Swiss National Bank) is 0%. The 3m-Forward implied yields are 0.91% and -0.23% respectively.
Why do carry trades matter? Because sudden moves – like those we witnessed starting last week – can result in a huge sell-off among risk-on assets (e.g. EM debt, equity, etc).
Which assets are vulnerable in such a sell-off?
| Vulnerability | Assets | Reason |
|---|---|---|
| Very High | High-beta US technology / AI / momentum | Liquidity + performance chasing + leverage |
| Very High | EM FX carry: MXN, BRL etc. | Direct carry targets |
| High | Japanese equities | Stronger JPY + domestic deleveraging |
| High | Crypto | Leveraged/global liquidity-sensitive |
| Medium/High | US Treasuries | Japanese repatriation could mean selling |
| Medium | European government bonds | Similar repatriation channel |
| Medium | Investment-grade credit | Liquid source of cash |
| Lower | Short-duration high-quality credit | Limited duration/carry vulnerability |
| Beneficiary | JPY | Short-covering/repatriation drives up Yen |
| CHF | Increasing funding role but safe-haven characteristics complicate it |
How big is the pool of international borrowing of these currencies? This is much harder to answer and is shrouded in some guess-work. The headline pool of international Yen borrowing is currently around Y360tn/$2.35tn (Source: BIS). However, this is misleading – it is not a proxy for the carry trade! This borrowing finances all sorts of activity: corporate financing, bank balance sheets, structured products, hedging and liquidity management – not just speculative carry. The BIS concluded “a rough middle ballpark” of some $250bn (=Y40tn) of FX carry positions immediately before the 2024 unwind. And one can’t use the entire derivatives market (some $14.2tn, end-2023) as this relates to the notional value of FX Swaps, Forwards and Currency Swaps where you have the Yen on one side of the transaction! So based on some degree of “guesswork”, here’s a breakdown of the current Yen carry estimate:
| Measure | Approx. size | What it tells us |
|---|---|---|
| Yen derivatives outstanding | Over $14tn | Nothing – way too broad |
| Cross-border yen borrowing, Mar-26 | $2.35tn | A useful broad ceiling for Yen borrowing |
| BIS 2024 carry estimate | $250bn+ | Probably too low in today’s terms |
| Hedge-fund FX forwards alone, 2024 | Some $160bn | Narrow subset |
| Current 2026, directional JPY carry estimate | $500bn–$1.0tn (mid-point: $750bn) | Reasonable working range |
In addition to the above, Switzerland enters the mix. Given above events with the Yen, the market has started changing funding currency rather than abandoning the carry trade altogether. The SNB rate is currently around 0% vs 1% in Japan. On 19th August, Reuters reported investors were increasingly switching from Yen to Swiss because the Swiss offered cheaper funding and generally lower intervention / policy risk i.e. less volatility (let’s see how long that lasts). Evidence from the CFTC (Commodity Futures Trading Commission) also showed Hedge Funds increasing their short-Swiss positions while reducing their short-Yen positions! This switch has only just started but, as things stand, is estimated to be between $50bn to $250bn of carry exposure in Swiss (assuming the Swiss takes some 10% to 25% of global carry of the $500bn to $1tn Yen figure referred to in the above table. A word of caution though: there is no robust evidence for the 10% to 25% share figure). The Yen unwind doesn’t mean the end of the carry trade……just the start of a switch from one FX to another. Two years on to the present day, the potential pool of vulnerability looks much larger even though the unwind has been fairly orderly. The market rally (from crypto to techno) is running out-of-steam. Tech is clouded in all sorts of rumours from excessive CAPEX pouring into data centres, a growing divergence between high earnings and declining cash flows, cheap Chinese competition (even though the latter is being deliberately funded at a loss), etc.
BUT, sitting alongside the carry trade is a second-order trade resulting in an Amplification effect….hence today’s caption! Amplification is comprised of Leverage, Margin Calls, Volatility-Induced deleveraging and Japan’s pool of foreign investments totalling some $3tn. Guess where one-third of this ($1.12tn) is sitting…….yep, in US Treasuries! Behind closed doors, I bet the Fed and BoJ have been engaging in some deep discussions on how to “manage” this entire issue. Heaven-forbid the Japanese investor tries to offload these treasuries in one go – US yields will fly through the roof and reopen the argument around the viability of the US$ and a potential collapse of the US fiscal system. This $3tn of foreign investments has come about over the years as the Japanese saver has gone on a quest to earn higher yield overseas (via bonds and equities). Now, look at the numbers:
- BoJ Policy rate = 1.00%
- Most likely September rate = 1.25% (probability = 97%)
- Japanese 10y JGB did push through 3% (currently 2.92%)
- US 10y Treasury = 4.8% to 4.9%
- Japanese investors are already reducing their foreign bond exposure!
The Yen is under attack from three different directions simultaneously: Rising Funding Cost PLUS Rising Yen PLUS Rising Domestic Japanese Investment Yields and begs the question “why take on FX risk/Hedging cost overseas” as JGB yields approach 3%? So it’s not just about the carry unwind…..rather the amplification caused from selling foreign assets.!
Conclusion:
- The above is not meant to imply the death of the carry trade…..instead we are looking at a switch of sorts.
- So far, the Yen carry-unwind risk has been quite orderly. Behind closed doors, I bet discussions have been frantic resulting in some sort of protocol / parameters being put in place to “guide” how this all plays out and limit dramatic movements.
- Choose your asset allocation wisely! As far as possible, avoid concentration in the most vulnerable assets that are most prone to carry-trades (see above table). Because carry positions are often leveraged, asset liquidations can be larger than the capital investors actually have invested! In a “normal repositioning”, some 20% to 30% of carry positions would get closed resulting in some $200bn to $300bn of “direct positions” being liquidated making the total, potential risk-asset selling in the order of $250bn to $400bn. The table below summarises different scenarios:
| Illustrative Scenario Analysis – not forecasts | Carry positions closed | Direct positions liquidated | Deleveraging / contagion assumption* | Potential total risk-asset selling |
|---|---|---|---|---|
| Normal repositioning | 20% to 30% | $200 to 300bn | Modest | $250 to $400bn |
| Serious unwind | 40% to 60% | $400 to 600bn | Meaningful | $600bn to $1.0tn |
| Full carry shock | 75% to 100% | $750bn to $1.0tn | Heavy | $1.0tn to $1.8tn |
| Disorderly systemic unwind | 100% plus correlated deleveraging (in line with hedge ratios) | $1tn+ | Severe margin/vol. shock | $1.5–3tn+ |
* Captures margin calls, volatility-targeting, options hedging and other leveraged strategies forced into reducing risk simultaneously.
- For perspective, in August 2024, the BIS estimated the carry universe at just $250bn. Yet, on 5thAugust, the TOPIX fell -12% in ONE DAY, the S&P 500 fell -3%, Eurostoxx fell -1.7%, the VIX briefly shot through 60 and AI/Tech stocks lost roughly $1tn of market value during the preceding July sell-off! You don’t need $1tn of carry positions to sell $1tn of equities! Between leverage, margin calls and volatility-induced deleveraging, the amplification runs its own course.
ECONOMIC & MARKET SUMMARY…
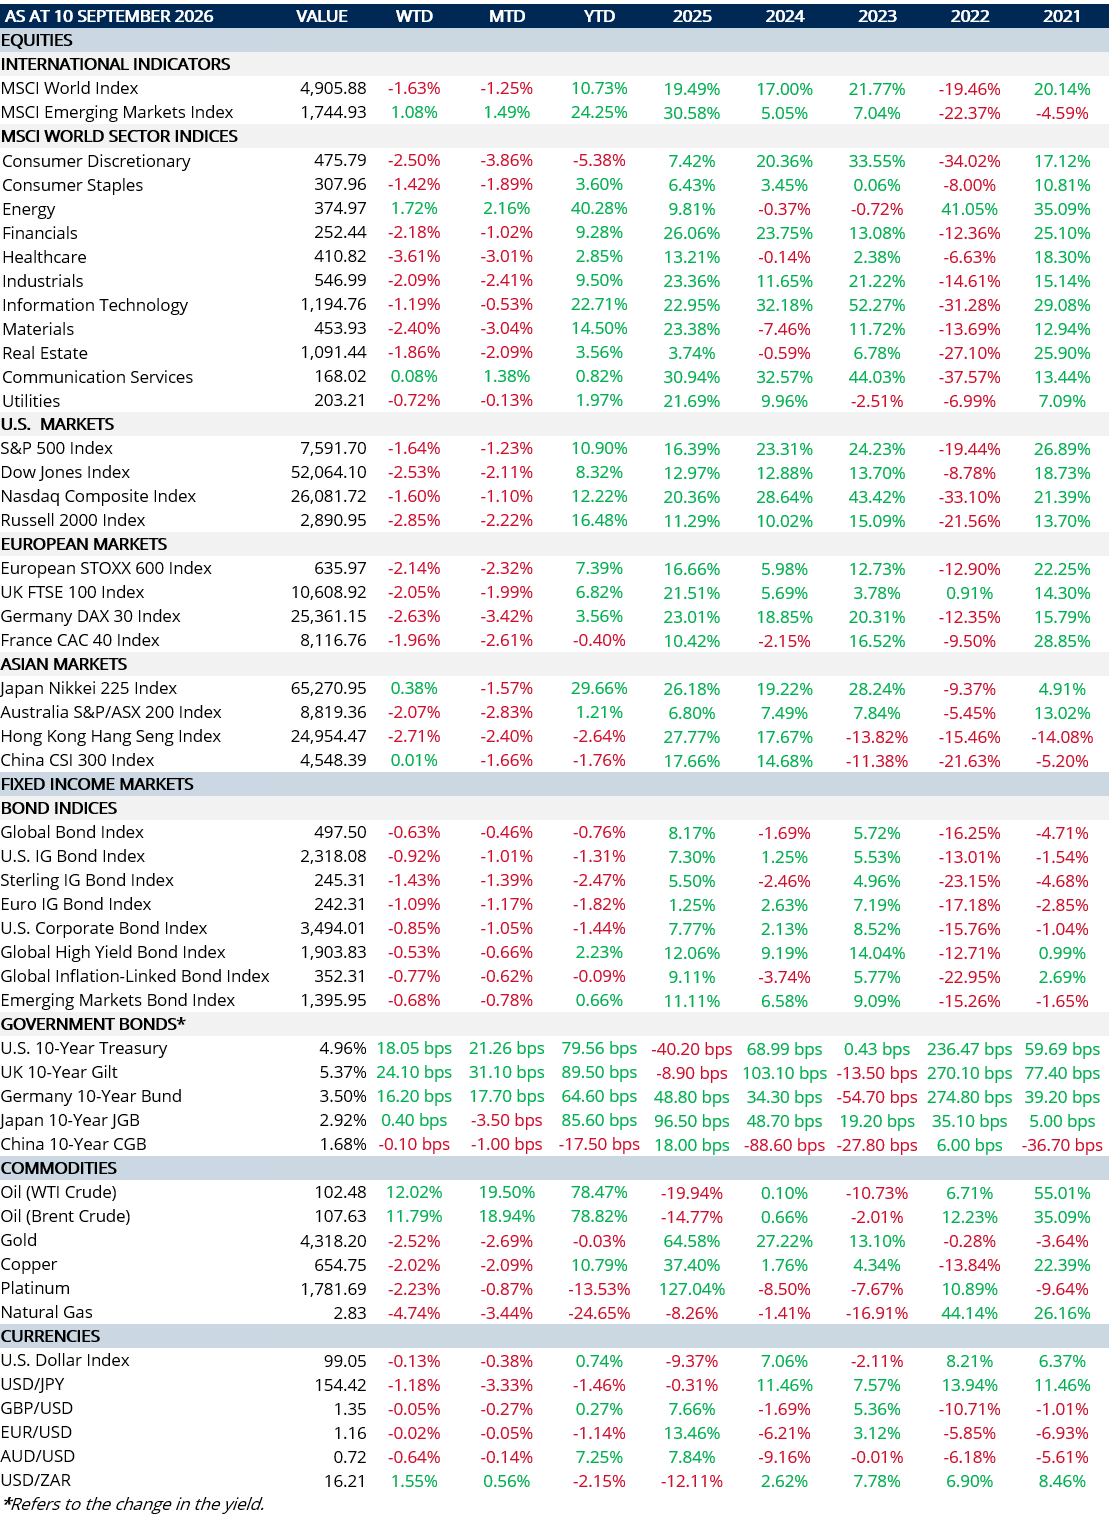
- It has been a rising yield story. Look at the table below to show the increases on the week (to cob yesterday). These are sizeable! The Yen carry-unwind (described above) is one part of it. Other factors are at play too: (1) Energy prices have spiked (Brent oil is now peaked at $109 pb, now at $104 pb) as Iran and the US dig in for what looks like a protracted war. Even Trump issued a warning that this will likely continue into his remaining two years. Oil shipments via Hormuz are about a quarter of pre-war levels; (2) Debt issuance is not abating (the US prints roughly $1tn every 3m to 5m). With Bessent attempting to shift issuance to shorter-dated (T-Bills) arguably makes things riskier (à financing long-term problems with short-term debt potentially setting the wheels in motion for a rate implosion!); (3) Trump is pressuring Warsh (the Fed Chair) to LOWER rates when indicators clearly point to an economy that’s still reasonably strong economy (as evidenced by payrolls, weekly jobless numbers, service and manufacturing activity, etc.).
- US PPI (Producer Price Inflation, the prices that companies pay each other) is surging. Excluding energy, Services PPI is running at 4.5% y/y while Goods PPI is over 5.0% y/y. Services accounts for nearly 70% of overall PPI final demand.
- The ECB raised rates on Wednesday with the deposit rate now at 2.5%. It marks the second hike since the start of the Iran conflict. The ECB called the hike a “no brainer” as inflation rises due to energy costs.