Crude prices have been quite subdued for some months. In late September, the Brent price oil hovered around $70 per barrel, while WTI (West Texas Intermediate) was in the mid-$60s range. These “suppressed” price levels are a function of two factors: (1) a market that, after a period of OPEC+ production cuts, is now facing increasing output from key producers and (2) a deceleration in demand growth. The latter is despite intermittent geopolitical jitters. Below, I have tried to analyse these supply/demand fundamentals and major geopolitical hotspots to understand where WTI oil prices may be headed over the next few months up to one year. It then looks at the strategic implications and ends with key risk factors to consider. For the most part, I have put content in tables to make it easier reading on the eye. Apologies if it seems long!
Surging Supply:
- Global oil production is on the rise from (1) OPEC+ producers unwinding cuts and (2) robust output from non-OPEC countries. World oil supply hit a record 106.9 million barrels per day (mb/d) in August 2025 as OPEC+ raised output and non-OPEC producers hovered near all-time highs. The IEA projects total production to climb by +2.7 mb/d in 2025 and another +2.1 mb/d in 2026, reaching some 107.9 mb/d next year. Much of this growth is coming from outside OPEC (e.g. United States, Brazil, Canada, Guyana and Argentina). Non-OPEC+ output is expected to increase by some +1.4 mb/d in 2025, roughly matching OPEC+ supply gains of +1.3 mb/d assuming current plans hold.
- The OPEC+ alliance (i.e. OPEC plus Russia and others) aggressively cut production in 2023 to shore up prices but is now gradually unwinding it to restore some of that output. On 7 September 2025, OPEC+ agreed to start unwinding its second tranche of cuts (in place since April 2023) by raising the output target +137,000 bpd in October. At that pace, it would take 12 months to fully restore the 1.65 mb/d of that second tranche. Worth noting, even despite this, the alliance would still have about 2 mb/d of cuts remaining in place when factoring in the first tranche.
- In practice, the actual supply boost may be smaller than announced because several members were already over-producing (vs their quotas). For example, Iraq, UAE, Kuwait and Kazakhstanhave been pumping a combined +1.1 mb/d above their official OPEC+ quotas in recent months. This means part of the production “increase” is just legitimizing existing, extra barrels. As of Q3 2025, OPEC+ had ramped up actual crude output by ~1.5 mb/d since early 2025 – well below the 2.5 mb/d that was targeted – due to capacity limits and some members’ non-compliance (e.g. Iraq signalled eagerness to export more such that in late September, crude oil flowed for the first time in 2½ years through the Iraq-Turkey pipeline from Kurdistan after a dispute was resolved thus allowing about 180,000–190,000 barrels per day of Iraq-Kurdish crude to reach Turkey’s Ceyhan port (only ~0.2% of global supply but symbolically important). Officials say flows could eventually ramp up to ~230,000 bpd as long as full compliance is observed. The Iraq-Kurdish restart, along with some African producers recovering output, adds slight downward pressure on prices, although it is far smaller than the supply increases coming from OPEC’s core Gulf members and U.S. shale.
Muted Demand Growth:
- On the other side of the equation, demand is expanding at a much slower pace vs last year. Both the IEA and OPEC have scaled back their demand growth expectations for 2024–2025 – citing mostly economic headwinds. The IEA’s latest forecasts estimate only about +700,000 bpdof global demand growth in 2025 – which is roughly on par with 2026. This would make it one of the slowest increases since 2009 (leaving aside the pandemic). OPEC’s forecast (July 2025 report) projected demand growth of around 1.29 mb/d for 2025 – only slightly higher than the IEA and still expressing a cautious outlook. They put it down to (in large part) weaker consumption in emerging economies and China’s softer import appetite.
- The IEA noted that OECD oil demand actually exceeded expectations in early 2025 (up ~80,000 bpd in 1H25, aided by lower prices) but is expected to contract later in the year, leaving full-year 2025 consumption roughly flat for advanced economies. Essentially, growth is coming entirely from developing nations and even there it’s relatively modest.
- High interest rates, slower economic growth and efficiency gains (e.g. more EVs) are tempering oil use globally. The recent, upbeat U.S. economic data announced last week (GDP growing 3.8% rate last quarter) helps support oil demand at the margin. The Fed cutting rates helps stimulate growth. Despite all this, only a tepid uptick in global consumption is expected. The U.S. EIA sees world oil consumption rising from around 102.9 mb/d in 2024 to 103.8 mb/d in 2025 (an increase of ~0.9 mb/d) and then to 105.1 mb/d in 2026. This is outpaced by supply.
Inventories Swing Up: Putting the above picture together, the net surplus is starting to show up in oil inventories. Following a period of draws in 2022 – to early 2023, global stockpiles have reversed course. By mid-2025, observed worldwide oil stocks had risen for six consecutive months. In July alone, inventories climbed by +26.5 million barrels, bringing the cumulative build (since January) to nearly 187 mb. Absorption, by China into its strategic reserves, helped reduce global inventories. However, as OPEC+ boosts output and refinery runs slow seasonally, stock builds are expected to accelerate. The IEA warned, under current supply trends, global stocks could rise by an “untenable” 2.5 mb/d on average in 2H25 while the U.S. EIA estimates inventory build will average 2.1–2.3 mb/d from late 2025 into early 2026. If production is not curtailed, we’re staring at a world glut – putting strong downward pressure on oil prices!
Price Implications?
| Geopolitics Stable (No major disruptions) |
Geopolitics Unstable (Supply shocks, sanctions, conflict) |
|
|---|---|---|
| Oil Supply > Demand (Structural Oversupply) |
Bearish – Glut & Growth • WTI: $40–50 • AE (Advanced Economies) GDP: +0.2–0.4 pp; EA (Emerging Asia) GDP: +0.3–0.6 pp • Inflation: −0.4 to −1.0 pp • Yields: −25 to −80 bps • Strong consumer boost; signals weak demand • U.S.: consumption up, shale capex slows • EA: subsidy savings, CAD improves • Global trade soft, energy equities lag |
Base Case – Soft Market • WTI: $50–60 • AE GDP: +0.1–0.3 pp; EA GDP: +0.2–0.4 pp • Inflation: −0.1 to −0.3 pp • Yields: ~3.8–4.0% • Real incomes supported, investment subdued • U.S.: shale steady, Fed cautious • EU/Japan: modest consumer benefit • EA: import savings aid growth |
| Oil Supply < Demand (Disruptions or strong demand) |
Transition – Tightening Fundamentals • WTI: $60–70 • AE GDP: 0 to −0.1 pp; EA GDP: −0.1 pp • Inflation: +0.1 to +0.3 pp • Yields: +5 to +30 bps • Mild inflation uptick, neutral growth • U.S.: shale cushions price rise • EU/Japan: consumption slows • EA: import bills edge higher |
Bullish – Geopolitical Shock • WTI: $80–100+ • AE GDP: −0.3 to −0.6 pp; EA GDP: −0.3 to −0.6 pp • Inflation: +0.3 to +1.0 pp • Yields: +25 to +80 bps • Stagflation risk; policy tightens • U.S.: shale output rises but Fed hikes • EU/Japan: negative terms-of-trade shock • EA: subsidy/fiscal pressure, FX weakens |
Strategic Implications?
The table below summarises the strategic implications from the four scenarios above. It’s a high-level view that amalgamates the macro implication and the type of calls (strategic positioning) re Equities, Bonds, Comms and FX. Remember, this is more theory based (past/textbook action). Markets have an uncanny way of surprising!
| Scenario | Macro Implications | Strategic Positioning |
|---|---|---|
| Bearish – Glut & Growth WTI: $40–50 |
• GDP boosted globally (+0.2–0.5 pp) • Inflation disinflationary (−0.4 to −1.0 pp) • Policy stance turns more dovish; potential rate cuts • Yields decline 25–80 bps; financial conditions ease |
• Bias to duration (govt/short duration bonds outperform) • Prefer growth equities, defensives, consumers • Energy underperforms; airlines, transport benefit • USD softer; EM FX supported by external balances |
| Base – Soft Market WTI: $50–60 |
• GDP stable (+0.1–0.3 pp), inflation mild (−0.1 to −0.3 pp) • Monetary policy remains neutral or slightly easing • Yields steady (~3.8–4.0%); risk assets supported |
Yes please • Balanced equity/bond allocation • Energy earnings stable, quality/growth rotation • Duration neutral to slightly long • FX range-bound, modest EM support |
| Transition – Tightening Fundamentals WTI: $60–70 |
• GDP slows slightly (0 to −0.1 pp) • Inflation re-accelerates (+0.1 to +0.3 pp) • Policy bias shifts hawkish; yields rise (+5–30 bps) |
• Reduce duration exposure (yields rising) • Favour energy, industrials; rotate into value • USD supported; JPY softens as risk sentiment holds • Commodities broadly bid, esp. oil-linked assets |
| Bullish – Geopolitical Shock WTI: $80–100+ |
• GDP slows sharply (−0.3 to −0.6 pp) • Inflation surges (+0.3 to +1.0 pp); stagflation risk • Central banks tighten aggressively; yields +25–80 bps |
• Short duration; consider inflation-linked bonds • Overweight energy, underweight discretionary • USD, JPY strengthen as safe havens • Consider gold and commodities as inflation hedges |
What are the key risks to watch out for?
| Risk / Trigger | Description | Macro / Market Impact |
|---|---|---|
| OPEC+ Policy Shifts | Unexpected quota changes or compliance issues could tighten or loosen supply rapidly. | WTI volatility ±$10–15; bond yields and inflation expectations respond accordingly. |
| Russian Supply Disruptions | Escalation of sanctions or infrastructure attacks could remove >1 mb/d from the market. | Bullish price shock (+$15–25), stagflation risk, EM FX pressure, safe-haven demand rises. |
| Iranian Sanctions / JCPOA Breakdown | Reimposition of UN sanctions or failure of diplomacy may cut >0.8 mb/d exports. | Upward pressure on crude prices, higher inflation expectations, risk-off sentiment. |
| Global Demand Weakness | Slower China/India growth or U.S. recession could sharply reduce oil demand growth. | Bearish price shock (−$10–20), bond yields decline, central banks turn more dovish. |
| U.S. Shale Supply Response | Faster-than-expected U.S. output growth could cap prices and limit OPEC+ leverage. | Keeps prices range-bound; reduces inflation risk, limits policy tightening. |
| Geopolitical Escalation in Middle East / Ukraine | Wider conflict or shipping disruption (e.g. Strait of Hormuz) could severely disrupt supply chains. | Severe bullish shock (+$20–30), inflation spike, yields surge, risk-off environment. |
Conclusion:
At present, the hard facts on supply and demand point to a comfortably supplied oil market through 2025, which on its own would favour lower WTI prices than seen in early 2023. Major agencies expect significant surpluses and have accordingly revised price forecasts downward.
However, these same facts have to be weighed against the fraught geopolitical climate. Oil’s “suppressed” pricing could quickly change if any geopolitical domino falls e.g. a new sanctions squeeze on Russia or Iran, an outright conflict that imperils Middle East oil routes……or an OPEC policy shift to defend higher price levels. One/some/all of these are quite possible. Look how Trump’s administration is actively trying to remove Russian oil from certain markets, the UN snapback is signalling a harsher treatment of Iran……and a war in Gaza has unsettled global diplomatic ties.
For now, barring an unforeseen crisis, the most likely trajectory is WTI prices will remain relatively range-bound or slightly soft in the coming months, as rising supply meets moderate demand. We may see WTI trade in the $60s or possibly dip into the $50s if inventories swell as expected. OPEC will do its best to maintain a balance: they won’t want a 2015-style glut to crash prices. On the other hand, they will want to avoid short-lived spikes – especially seeing how tight the spare capacity cushion is e.g. the U.S. Strategic Petroleum Reserve is not as full as it once was.
Hard fundamentals currently lean bearish for oil….but geopolitical undercurrents provide a bullish undertow. The next 6–12 months for the WTI see-saw will likely be fairly well balanced (a period of relatively low prices) – unless and until geopolitics tip that see-saw.
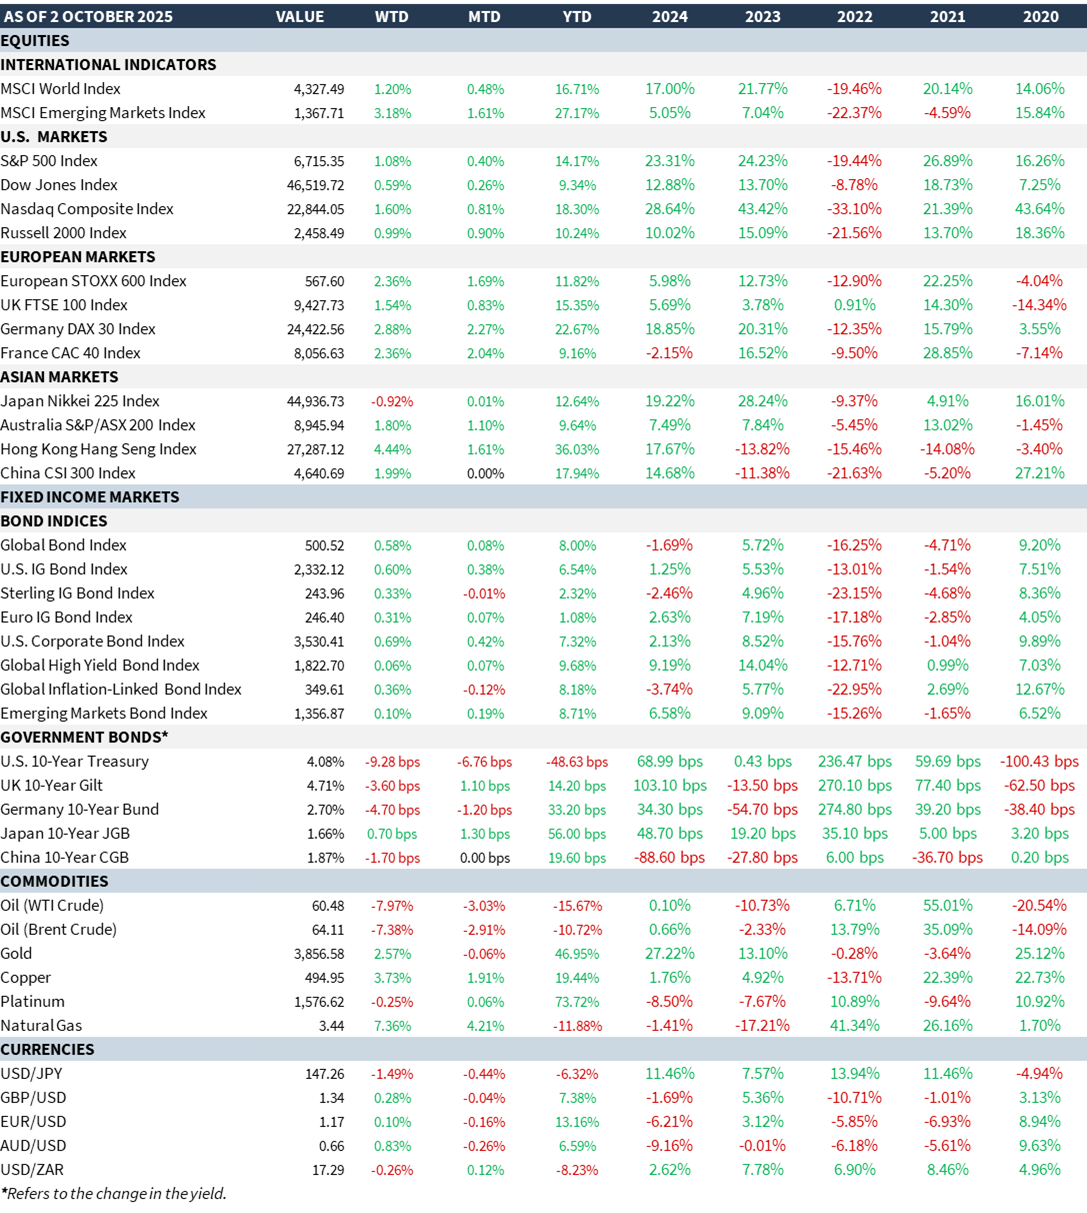
MARKET SUMMARY...
As Q3 came to a close, it was another strong one for markets with global equities and bonds both advancing. The S&P 500 piled on +8.1% (total returns). Liberation day tariffs almost seem like a thing of the past and, so far, the inflationary impact specifically from these tariffs are either not as bad as people had feared or it is on a slow burner and will hit further down the line. Markets received a big boost as the Fed pivoted to a rate cut with indications of more to come. On the back of this, Treasuries rose strongly (+1.6%) while Gold soared (+11.9%) and is still flying. Price targets are being raised repeatedly. In the process, Silver is catching its slipstream. Key driver for silver is inventory which is depleting fast. However, pressures around the ever-mounting fiscal deficit and later stage inflation are impacting long bonds, especially Europe given the instability of the French parliament. For the US$, it has experienced its worst, 1H performance since 1973.