Understandably, many investors have been concerned about the sheer scale of the rally we have witnessed. They are likening it to another “dot.com” moment. I think the latter comparison is a panic reaction and is not comparing like-for-like. Tech companies today are real – they are producing, profitable, cash-rich and extremely well-funded (referenced below). Their ability to raise funds is not in doubt. This was not the case in the “dot.com” era. The real question is how profitable can the tech sector continue to be from here?!
I have addressed the above question in three parts without getting into excessive detail:
FIRST: a quantitative approach utilising a couple of different valuation methodologies: the table below simply compares the PEG Ratio approach and the Earnings Yield to Bond Yield approach in deriving a Fair Value (FV) for each of the respective indices used. [NB: the indices used are price indices, not total return]. I have simply the taken data (e.g. earnings) provided by various sources at face value. I have not attempted to calculate it independently. Bear in mind, Analysts are almost always wrong. They also tend to adopt a herd mentality approach. Additionally, they typically project earnings up to 5 years out and, in a world of Tech, that’s dangerous as so much can and does change even after just 12 to 18 months! The table below summarises the two approaches:
| Index / Group | EY-Based Valuation | PEG-Based Valuation | Difference | Explanation |
| MAG-7 | Undervalued by 16.3% | Overvalued by 8.7% | +25.0% | High EPS growth supports PEG valuation more than rate-based EY approach |
| Nasdaq-100 | Overvalued by 11.0% | Overvalued by 58.8% | −47.9% | EY model appears more forgiving due to lower discount rate |
| S&P 500 | Undervalued by 6.3% | Overvalued by 121.4% | −127.7% | PEG penalises low growth; EY sees value given current bond yields |
| Euro Stoxx 50 | Undervalued by 59.8% | Overvalued by 48.1% | −107.9% | Low rates vs modest growth makes EY view it as cheap while PEG sees a mismatch |
| MSCI EM | Undervalued by 47.9% | Undervalued by 2.5% | −45.4% | High yield and EM discount support stronger EY-based valuation |
The table below is purely a guide and summarises the data used in arriving at the valuation summary above between the two models.
| Index / Group | Fwd P/E | EPS
Growth |
PEG
Ratio |
EPS Growth
Needed for PEG=1 |
EY (%) | Implied EPS | 10Y
Yield |
Fair P/E
(EY=BY) |
Fair Value
(EY=BY) |
Actual Level |
| MAG-7 | 28.3 | 31.0% | 0.91 | 28.3 | 3.53% | 480.57 | 4.11% | 24.33 | 11,692.27 | 13,600.00 |
| Nasdaq-100 | 27.0 | 17.0% | 1.59 | 27.0 | 3.70% | 930.99 | 4.11% | 24.33 | 22,650.99 | 25,136.62 |
| S&P 500 | 22.8 | 10.3% | 2.21 | 22.8 | 4.39% | 296.22 | 4.11% | 24.33 | 7,207.03 | 6,753.72 |
| Euro Stoxx 50 | 15.0 | 10.13% | 1.48 | 15.0 | 6.67% | 377.02 | 2.68% | 37.31 | 14,066.62 | 5,655.25 |
| MSCI EM (Broad) | 12.68 | 13.0% | 0.98 | 12.68 | 7.89% | 295.00 | 4.11% | 24.33 | 7,177.35 | 3,740.56 |
PEG stands for Price / Earnings-to-Growth. It adjusts the traditional PE Ratio by incorporating expected earnings growth. In essence, it helps investors judge whether a stock/index is fair value (FV) relative to its growth potential. If PEG =1, it is FV; Below 1, it is undervalued; Over 1, it is overvalued. So, in the PEG column, the S&P 500 line looks really scary suggesting it is 121% overvalued while the Magnificent-7 is close to its FV (8.71% overvalued). The PEG Ratio is most appropriate for growth-centric sectors/stocks like the Mag-7 but, for broad(er)-based indices like the S&P 500 (= mix of cyclicals, defensives, etc.), it is less precise.
The EY vs BY is considered to be a better measure. It compares the Earnings Yield to the long-term government Bond Yield. Using this approach, suddenly, the S&P 500 is 5.83% undervalued while the Mag-7 becomes overvalued. The latter is a growth play and not well-served by the EY to BY approach. Notice also how the Nasdaq-100 becomes much less overvalued (58.82% to 11.52%) – it is less concentrated vs the Mag-7 (100 names vs 7).
SECOND: From the above, we can run a straightforward scenario analysis. To do this, I have applied the 10y Government Bond Yields pertinent to each region/sector as shown above (US 10y = 4.11% and German 10y Bund = 2.68%). Why only Bond Yields? Because bond yields are fundamental to modern equity valuation: they define the Discount Rate (DR) used in a Discounted Cash Flow (DCF) model. They are by no means the only variable – others include Geopolitics (via Equity Risk Premia), Liquidity (via QE, QT), Sector Composition (via shifting weights), Inflation. Ultimately – albeit delayed – these others find their way into Bond Yields. To keep it simple, I have run a Best Case and a Worst Case:
| Index / Group | Scenario | Yield
(%) |
Fair P/E | Fair Value
(EY = BY) |
% Over/Under vs Actual |
| MAG-7 | Best Case | 3.00 | 33.33 | 16,017.40 | −15.09% (Undervalued) |
| Base Case | 4.11 | 24.33 | 11,692.27 | +16.32% (Overvalued) | |
| Worst Case | 5.50 | 18.18 | 8,736.76 | +55.66% (Overvalued) | |
| Nasdaq-100 | Best Case | 3.00 | 33.33 | 31,029.90 | −18.99% (Undervalued) |
| Base Case | 4.11 | 24.33 | 22,650.99 | +10.97% (Overvalued) | |
| Worst Case | 5.50 | 18.18 | 16,931.66 | +48.51% (Overvalued) | |
| S&P 500 | Best Case | 3.00 | 33.33 | 9,873.58 | −30.60% (Undervalued) |
| Base Case | 4.11 | 24.33 | 7,207.03 | −6.29% (Undervalued) | |
| Worst Case | 5.50 | 18.18 | 5,383.63 | +25.45% (Overvalued) | |
| Euro Stoxx 50 | Best Case | 2.00 | 50.00 | 18,851.00 | −70.00% (Undervalued) |
| Base Case | 2.68 | 37.31 | 14,066.62 | −59.80% (Undervalued) | |
| Worst Case | 4.00 | 25.00 | 9,425.00 | −40.00% (Undervalued) | |
| MSCI EM | Best Case | 3.00 | 33.33 | 9,833.33 | −61.97% (Undervalued) |
| Base Case | 4.11 | 24.33 | 7,177.35 | −47.88% (Undervalued) | |
| Worst Case | 5.50 | 18.18 | 5,362.68 | −30.23% (Undervalued) |
The message from the above is clear – if the Fed cuts savagely (= Best Case), yields will initially drag lower resulting in markets rallying even more (think back to the lower discount rates for valuation purposes). The new Fed team being assembled is leaning increasingly in this direction. The worst-case scenario is where the yields rise. I have used 5.50% – not that far from today’s 4.11%. What is the likely catalyst for this? Inflation and /or a worsening fiscal deficit!
Notice how even in the event of US yields hitting 5.50%, both Eurostoxx 50 and MSCI EM are projected to do well in a Worse-Case scenario. This is entirely because of the way the model uses earnings yields in its calculations: the EY for both (see second table above) is close to 7% and 8% respectively. The reality is if there is carnage in the US, no region, stock or sector is going to be immune. It never follows theory!
THIRD: What really matters from this point onwards is what the future holds for tech – especially around the adoption of AI. The latter is powering the former. In this regard, the picture is looking murky. There have been several studies (e.g. FT, McKinsey, Bain, MacroStrategy, DB) that have looked at (1) how AI is being used, (2) how are companies turning a profit, (3) how the wall of money chasing is AI companies and (4) how it impacts growth.
Some key findings:
- Bain & Co forecast the AI industry will need $2tn in annual revenue by 2030 to fund expected compute demand with a projected shortfall of $800bn by 2030.
- An MIT study revealed 95% of companies have reported zero ROI (Return On Investment) to date. McKinsey found only 5% of GenAI implementations deliver real business value (=operational transformation or financial return).
- More compute power does not equal better results (with diminishing returns from ChatGPT).
- Competition from China will likely undercut Western firms’ ROI and revenue.
- The CAPEX (Capital Expenditure) commitments are huge (e.g. Stargate projected cost: $500bn to $1tn; Nvidia has committed $100bn to fund OpenAI’s buildout raising concerns of circular financing; Meta has pumped $26bn for one US Data centre.).
- There is a big divide between Developers (who are willing to risk many billions based on their vision) while Investors (e.g. Einhorn) see it as “tremendous capital destruction”. Investors turn to the “dot.com” era for parallels (huge valuations, speculative bets and poor monetisation) and highlight similarities with the fibre-optic overbuild in the 1990s.
- An FT report showed over 70% of AI usage is non-work related with individuals using AI more as a decision-support tool rather than a full work assistant. This has productivity implications! An MIT report noted there was a “shadow AI economy” resulting in employees using AI privately at work outside official company systems leaving organisational deployments stuck in pilot phases.
- Besides some sectors like media, companies face challenges embedding AI into their workflows. About 15% of the global, working population use AI with the highest adopters in UAE (59%), Northern Europe, US, Canada and Singapore. It is considerably lower in South Asia and Sub-Saharan Africa. In terms of sectoral patterns, it varies markedly (e.g. US: IT, Finance, Career Support, Brazil: Legal System/Judiciary use, India: software dev. And code generation).
- The winners are those companies focusing on customisation, workflow integration and learning capability – not generic deployment. They use external partners (instead of building inhouse, focus on narrow, high-impact use cases, favour systems that adapt, integrate and learn (Agentic) and treat AI tools as business solutions – not just SaaS.
In summary, the impact on the above indices and groups can be summarised as shown in the table below. The success of these companies from here rests on AI adoption spreading its wings. In the short time AI has been in operation, its adoption has been good (e.g. 15% of the global working population) and, so far, still quite narrow.
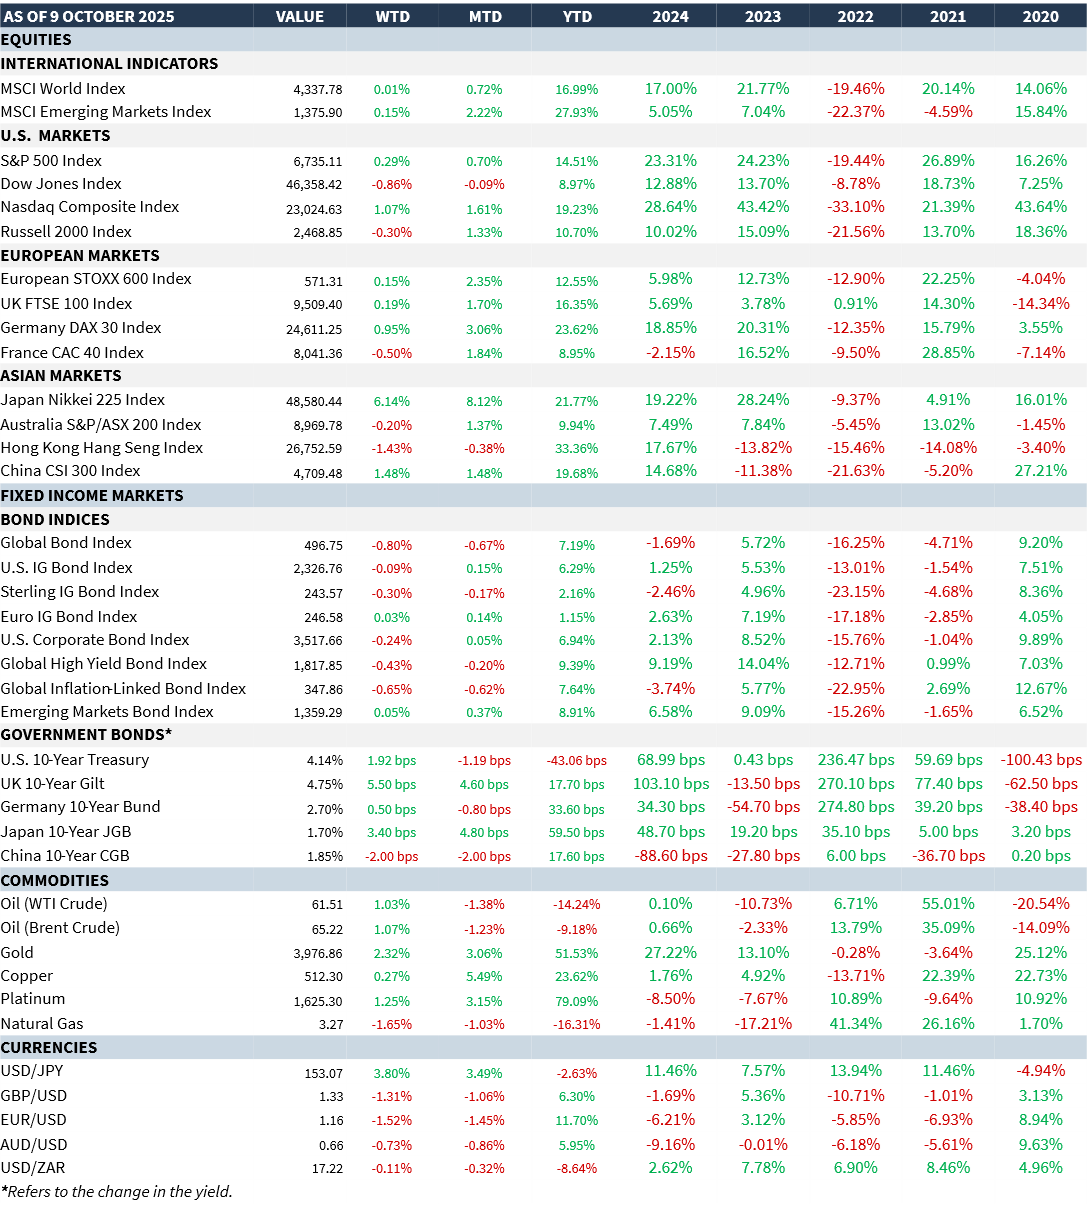
MARKET SUMMARY...