Panic Ahoy……….
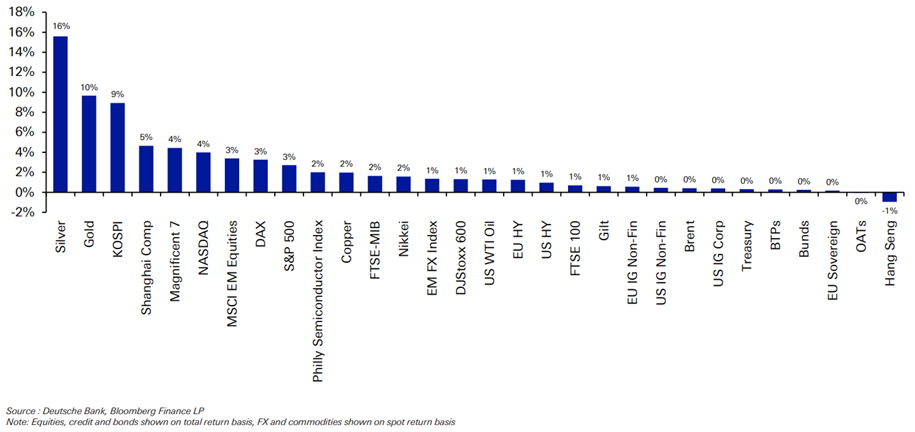
First, a quick recap of August. The usual chart format below (courtesy: DB) shows the total return performance (US$ terms) of selected assets:
- Overall, August was a solid month. Economic data was strong and activity indicators reached a high.
- Equities performed well on the back of the above economic picture and strong earnings. In the US, the S&P 500 was up almost 3% while the Mag(nificent)-7 gained 4.4%.
- It was a month for risk assets – but long-dated bond yields are flashing red (a story that is continuing into September, see more below). The US 30y Treasury hit 5.31% on 18th August; Germany’s 30y reached 3.81%, its highest level since 2011. The increase is a combination of the risk-on environment but also inflation fears due to Hormuz. The latter is not dissipating. Commodities, especially food prices, are sharply higher. There is another factor: fiscal concerns – which are ballooning on the back of rising interest rate servicing costs. The US yield curve flattened aided by the Treasury buyback programme (quasi-QE) while the middle of the curve saw yields rise.
- Gold (+9.7%) and Silver (+15.6%) rallied on the back of the treasury by-back programme.
- European bonds underperformed. 10y French (+18bps), Italian (+13bps) and German (+12bps) yields all rose (i.e. bond prices fell) as did Japanese 10y bonds which climbed +15bps as speculation mounts over further rate hikes to support the Yen.
- A combination of Hormuz and El Niño saw food prices record some significant gains: Corn futures +16.8% (biggest monthly increase in five years); wheat +18.3% (strongest rise in four years); Sugar +21.5% (its largest monthly advance since 2018).
- The Philly SOX rose just +2.0% after July’s hefty fall; Oil moved modestly.
Going into September? A really turbulent start!
- There has been severe military escalation between the US and Iran again – and each time it seems to get stickier! The US launched fresh airstrikes while Iran launched retaliatory missile and drone attacks at the US and its regional, allied bases (Jordan, Iraq, Kuwait & Bahrain). Centcom (US Central Command) cited (1) an imminent maritime threat (Hormuz) on Larak Island claiming the Islamic Guard (IRGC) was preparing rocket launchers, (2) retaliation for attacks on US personnel and (3) escalation due to a fractured ceasefire (tantamount to growing US impatience). On the back of all this, oil prices have been rising again and are hovering at/around $90 pb….still far above where it was pre-war.
- Hawkish Central Bank (CB) adjustments following Kevin Warsh’s (KW’s) Jackson Hole symposium resulting in money markets heavily pricing in a rate hike at the upcoming 16th September meeting. His commitment to inflation is clear but he is wrestling with three factors: (1) stick to a 2% inflation target even though the latter is materially above it, (2) reject any form of forward guidance and (3) work around the Treasury actively interfering with long-end rates. For KW, 2% is fixed but diagnose supply-side shocks carefully. If underlying inflation fails to move clearly and sufficiently quickly toward 2%, the Fed will hike. At the same time, Eurozone (EZ) inflation jumped to 3.3% in August forcing markets to price in an almost certain ECB rate hike!
- Corporate debt crowding from the tech “hyperscalers” is resulting in governments facing intense competition for capital thus driving up borrowing costs. These same hyperscalers have issued a staggering $220bn in corporate debt so far this year to fund massive data centres and AI infrastructure resulting in a recalibration of the supply-demand in fixed income markets. Add to this SpaceX’ bond issuance (largely unexpected) and semi-conductor companies bringing large deals to market despite modest funding needs and you can see the pressure this has added to borrowing costs.
- Unsustainable fiscal deficits is leading to heavy issuance (printing money) which in turn is driving up term (risk) premia. US national debt just crossed $40tn; there is an impending autumn budget in the UK that is fuelling nervousness.
Just look at some of the milestones reached by bond yields this year and their potential impact on interest-servicing should such levels persist:
| Sovereign Bond | Recent Yield Milestone (Sept. 2026) | Historical Context | EXTRA Annual Cost Per #10bn Borrowed | Impact on the Projected TOTAL ANNUAL Interest Servicing Cost based on the milestones reached | TOTAL National Debt (to mid-2026)* |
| UK 10y Gilt | 5.29% | Highest borrowing cost since August 2007 | £130m (vs a 4% baseline) | £157.6bn | £2.98tn |
| US 10y Treasury | 4.80% | Highest since January 2025 | $80m (vs a 4% baseline) | $1.92tn | $40.10tn |
| German 10y bund | 3.37% | Highest since 2011 | €137m (vs a 2% baseline) | €92.0bn | €2.73tn |
| Japanese 10y JGB | 3.00% | First breach of 3% since 1996 | Y200bn (vs a 1% baseline) | Y40.2tn | Y1,340tn (=Y1.34 quadrillion!) |
*Illustrative Only: it does not imply the entire national debt immediately refinances at the 10y milestone yield! The ACTUAL interest will depend on debt maturity, the refinancing schedule, instrument mix (e.g. 2y, 5y, 10y, 30y, etc.) and prevailing rates at issuance.
So how does one manage a portfolio in the above environment? It’s a reasonable assumption to say none of the above factors are going away any time soon. Furthermore, an Asset Allocation survey by ASR (Absolute Strategy Research) revealed the following findings:
- Asset allocators are still positive on risk
- Investors still expect the global economy to improve
- Investors have become less worried about the prospects for core inflation
- Asset allocators do not see a return to an accommodative economy
- Asset allocators remain cautious on bonds
- Expectations for corporate earnings support US corporate debt
- Investors do not think the bull market in equities is over
- Expectations for the US$ remains subdued
Against this background, we have the following, dominant themes:
- The AI buildout continues to gain traction and is starting to spill over into user segments as prices come down.
- Short duration liquid credits (corporate and government) are attractive and less interest-rate sensitive vs the long-end.
- Short duration private credits with very low (under 2 years) duration where the cash flows are clear and there is good protection (security/collateral) built in…..even with credit insurance overlayed on top.
- Inflation-linked such as infrastructure investments with variable coupons (subject to a good floor).
| Strategic Theme | Preferred Regions / Countries | Strategic Allocation | Expected Annual Return (3y to 5y) | Expected Portfolio Contribution |
| AI Build-out & Digital Infrastructure | US (70%), Taiwan (10%), South Korea (10%), Japan (10%) | 30% | 20% to 25% | 6.0% to 7.5% |
| Short-Duration Liquid Credit | US (40%), Europe (30%), UK (20%), Australia (10%) | 25% | 6% to 7% | 1.5% to 1.8% |
| Short-Duration Private Credit (<2 years) | US (35%), UK (25%), Australia (20%), Europe (20%) | 25% | 9% to 11% | 2.3% to 2.8% |
| Inflation-Linked Infrastructure | North America (35%), Europe (25%), Australia (20%), UK (20%) | 20% | 8% to 10% | 1.6% to 2.0% |
| TOTAL SYNTHETIC PORTFOLIO | Diversified | 100% | 12% to 14% | 12% to 14% |
The above construct would deliver the following investment characteristics:
Income Yield = 5% to 6%
Capital Growth = 7% to 8%
Duration Risk = LOW (well below 2y)
Inflation Protection = High
Credit Quality = High (on a secured basis)
AI Exposure = High (Growth component)
Liquidity = Moderate to High
Geography = US: 40% to 45%; Europe (incl. UK): 30% to 35%; Australia/NZ: 10% to 15%; Japan: 5% to 10%; Taiwan & Korea: 5% to 10%
From a Scenario Analysis (3y to 5y time horizon), we have the following range:
From a Scenario Analysis (3y to 5y time horizon), we have the following range:
From a Scenario Analysis (3y to 5y time horizon), we have the following range:
| Scenario | Macro Backdrop | Expected Annual Return | Peak Drawdown | Probability |
| Best Case | AI monetisation accelerates; productivity materially exceeds expectations; inflation is contained; bond yields stabilise; strong earnings growth | 18% to 22% | -5% to -8% | 20% |
|
Base Case |
AI continues to expand; earnings remain robust; inflation proves sticky but manageable; yields drift modestly higher; private credit performs well |
12% to 14% |
-10% to -14% |
60% |
| Worst Case | AI investment disappoints or monetisation is delayed; inflation reaccelerates; long-end yields rise sharply; recession; widening credit spreads | 0% to +4% | -20% to -28% | 20% |
ECONOMIC & MARKET SUMMARY…
- The Yen carry-trade risk has materially increased this week. The Yen strengthened some 2% yesterday (Thursday). Remember the transmission mechanism: If BoJ Hikes à JGB Yields rise à Yen rises àCarry Returns fall à Yen short covering à Yen rises even more à Leveraged positions are liquidated à Global risk assets fall! And the BoJ is expected to hike in September (77% probability) following hawkish BoJ commentary! The current policy rate is 1.00%; 1.25% is expected to be announced this month and then rising to some 2% in 2027. While the carry-unwind risk has moved from moderate à elevated, it is not disorderly. The danger is that both Japanese funding costs AND the Yen are rising. This is potentially far more dangerous than a mere +0.25% rate hike! Meanwhile, investors have begun considering the CHF (Swiss Franc) as an alternative funding currency as Swiss rates are substantially below Japanese rates.
- US economic releases speak to stability/strong expansion. ISM Manufacturing was at 54.6 (expansionary), JOLTS data showed vacancies rising some 89K, Initial Jobless claims barely changed, Q2 productivity rose +1.4% y/y. Nothing in all this that warrants a rate change.
- EU headline inflation jumped to 3.3% y/y on the back of energy. Otherwise, the core rate actually fell to 2.4% (from 2.5%) while services inflation fell to 3.0% (from 3.3%). Manufacturing registered 52.7, its highest since May 2022 strongly aided by new orders. The ECB is expected to raise rates and then again at year-end.
- China’s official manufacturing is still contracting (despite a rise in new orders) on the back of weak domestic demand. However, private manufacturing was considerably stronger; the divergence shows production/exports are compensating for weak consumption.
- Brazil’s Q2 GDP beat expectations but household consumption fell back; very high 14% policy rates are weighing on the economy.