When markets move from investment phase à “proof-of-return” phase
While events in the Middle East (ME) have increased the cost of capital around the globe, they have not created the underlying technology problem we are witnessing. What is that technology problem? Since about late-June, investors have been reassessing the AI investment cycle around the following:
- Can hyperscalers monetise AI quickly enough to justify such vast spend?
- To what extent will FCF be weakened by rising costs (e.g. power, financing, depreciation and training)?
- Are earnings (of the chip-industry) near a cyclical peak?
- Will cheaper competitor models, memory chips and semiconductor equipment erode Western and Korean pricing power? Korean names have taken quite a hammering over this point!
- ……or is it simply the case that valuations – and leveraged positioning – were simply too extended after the first-half rally? They are less willing to value AI infrastructure purely on projected demand. They now require evidence this vast and unprecedented CAPEX spend will actually translate into something durable and beneficial, generating sustainable revenues, free cash flow (FCF) and Returns On Invested Capital (ROIC) – and this is all BEFORE Chinese competition brings prices crashing down for equivalent computing capability!
From a market perspective we have two, overlapping transmission mechanisms at play:
(1) ME à Oil à Inflation à Yields à Lower Valuation Multiples and
(2) AI CAPEX à Weaker FCF à Uncertain Returns à Earnings-Expectation Risk à Semiconductor Derating. This explains why we have seen some violent declines – even on days when oil was stable / falling.
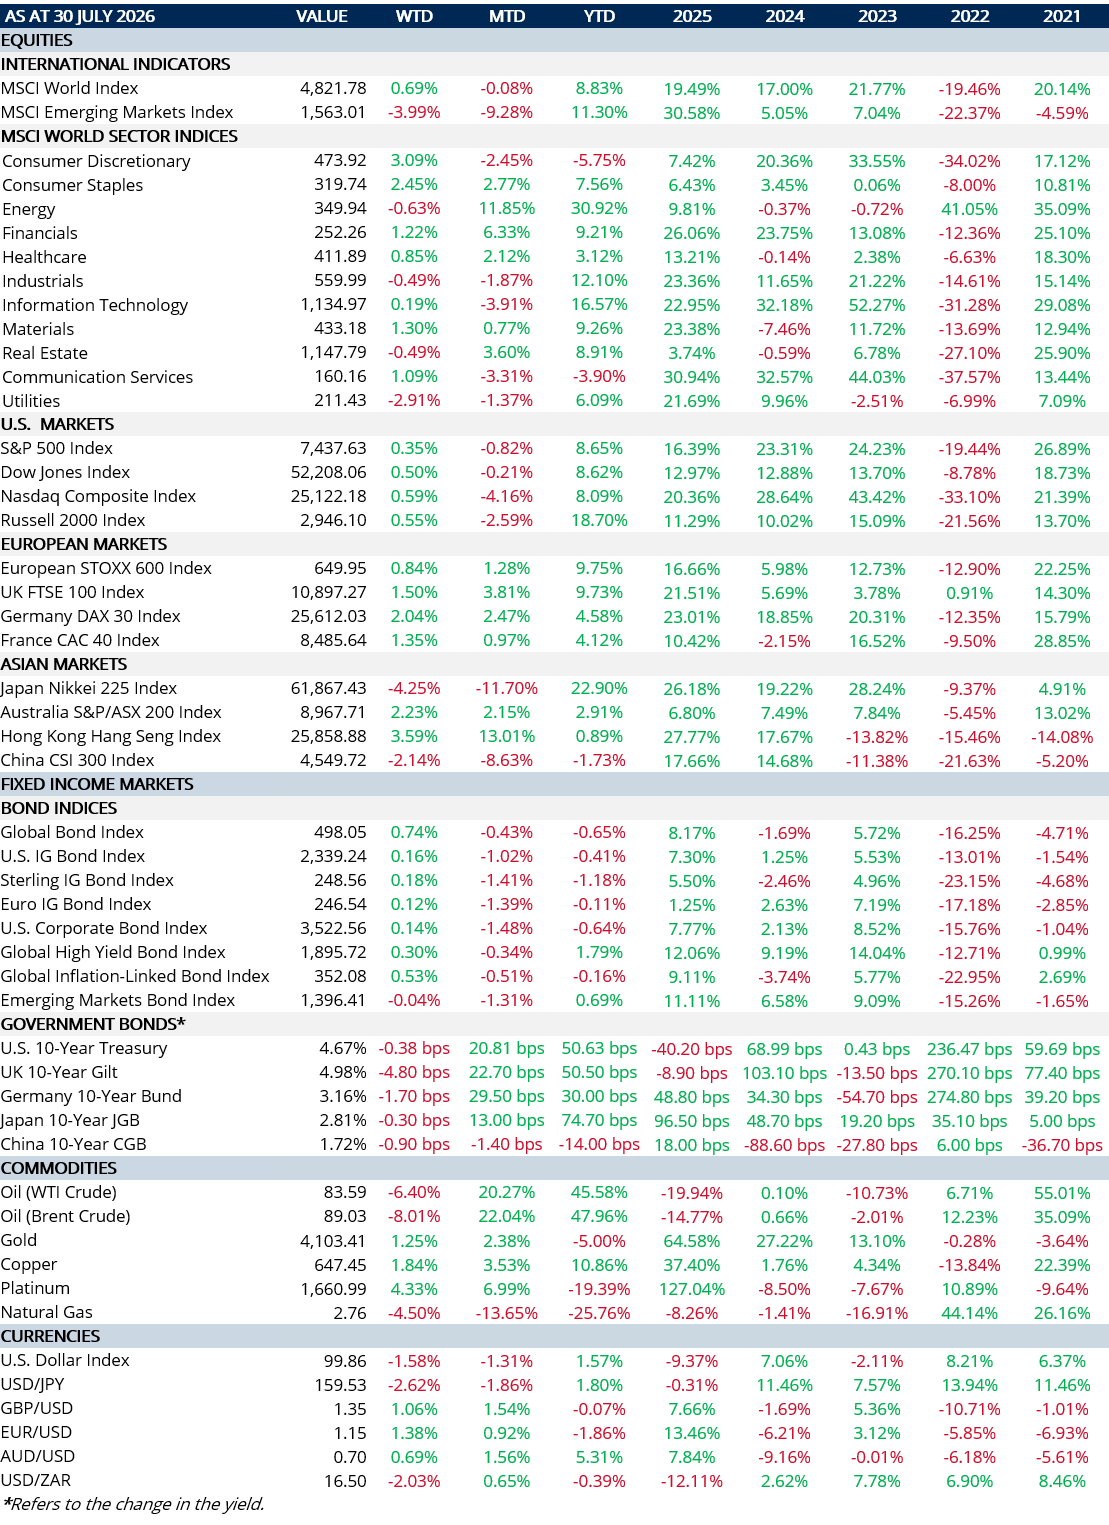
The table below shows how markets have changed (i.e. repriced the AI investment theme) since late June:
| Market / Sector | Performance since end-June to 30th July | Investment Interpretation |
| SOX (Philly Semiconductor Index) | -18.01% | Severe correction: AI payback now matters more than AI spending. |
| Nasdaq Composite | -4.16% | Correction: A Valuation reset is underway. |
| KOSPI (Korea) | -34.01% | Sharp correction: Leverage amplified the sell-off. |
| Nikkei 225 (Japan) | -11.70% | Correction: Technology exposure hurt performance. |
| Europe (Eurostoxx 600) | +1.28% | Resilient: Defensive sector mix cushioned the impact. |
| Hyperscalers | MSFT: +20.93%, AMZN: -1.19%, META: -4.31%, GOOGL: -6.63% | Volatile: Focus has shifted to ROIC and FCF. |
| Semiconductor Manufacturers | NVDA: -2.52%, TSMC: -15.55%, INTC: -34.73% | Weak: Earnings Sustainability matters more than current earnings. |
| Energy | +20.01% | Fanning the Flames: Inflation headwind – but not the principal cause. |
| Government Bonds | See Market Table at end | Rising Cost of Capital: Higher yields à higher discount rates; pressures growth valuations. |
Looking at the above, there is a general theme here: despite the sharp corrections being witnessed, earnings are still strong at this moment in time – there is no dispute around this. AI demand has not collapsed and company earnings are not deteriorating. What markets are disputing and saying is that “we no longer believe TODAY’S earnings justify YESTERDAY’S valuations”. SK Hynix (a Korean company) is a case in point: they reported record revenue, record operating profit, record HBM (High Bandwidth Memory) demand and continued capacity expansion. Nevertheless, its stock price has fallen because investors think this is as good as it gets for them and the next four years won’t be as good as previously assumed. That’s market psychology for you! Six months ago, the question being asked was “can they build enough AI?”; now it’s “Will they ever earn enough on all this investment?”
This leads me to exactly that last point: just how large the AI market could become over the next 5 years? This directly addresses the issue of valuation! The table below summarises some of the key segments, their likely revenue growth and behavioural impact on earnings:
| AI Value Chain | Current Earnings Picture (2026) | Revenue Outlook (2026–31) | 5-Year Earnings Outlook | 5y Earnings Conviction | Investment View |
| AI Accelerators & Custom Silicon | Record revenues, record margins and exceptional EPS growth, driven by AI training demand (Nvidia, AMD, Broadcom, etc.) | 20% to 30% CAGR | Above market but earnings growth likely to moderate as competition, custom chips and inference pricing increase. | YES | Structural winner, although valuation upside is now more dependent on execution than multiple expansion. |
| HBM (High Bandwidth Memory) | Record earnings supported by severe supply shortages, high utilisation and exceptional pricing power (SK Hynix, Micron, Samsung). | 20% to 30% CAGR (highly cyclical) | Strong initially, before gradually slowing as new capacity eases shortages and pricing normalises. | YES – but highly cyclical | Probably the strongest near-term earnings story, but also the greatest cyclical risk. |
| Advanced Foundries & Packaging | Very strong earnings supported by constrained leading-edge capacity and premium pricing (TSMC, ASE, etc.). | 15% to 25% CAGR | Above market with relatively durable earnings supported by technological barriers to entry. | YES | One of the most resilient beneficiaries of long-term AI investment. |
| Networking & Optical Infrastructure | Strong earnings momentum as AI clusters become larger and more interconnected. | 15% to 25% CAGR | Above market, benefiting from increasing data-centre complexity and bandwidth requirements. | YES | Often overlooked but likely to remain a significant beneficiary of AI infrastructure expansion. |
| Storage | Earnings recovering after previous semiconductor downturn; AI demand providing structural support. | 10% to 20% CAGR | Around market to modestly above market, depending on enterprise AI deployment. | SOME | More of a cyclical recovery than a pure AI growth story. |
| Cloud Platforms & AI Software | Strong revenue growth, although earnings remain diluted by unprecedented CAPEX, depreciation and infrastructure investment (Microsoft, Alphabet, Amazon). | 25% to 40% CAGR | Well above market, assuming successful monetisation of AI services and improving operating leverage. | PROBABLY THE MOST | The next major phase of AI earnings growth is likely to migrate here. |
| AI-Using Companies (Banks, Healthcare, Manufacturing, Retail, Professional Services) | AI contribution to reported earnings remains relatively modest and difficult to isolate. | Not directly measurable | Potentially well above market as productivity improvements feed through to margins, returns on capital and free cash flow. | JUST GETTING STARTED | Potentially the largest long-term earnings opportunity of the entire AI value chain. |
Some notes/observations to the above:
- The AI opportunity remains substantial. IDC estimates that global AI infrastructure spending reached approximately $318bn in 2025 (more than double 2024’s level) and forecasts it to exceed $1tn by 2029—equivalent to an annual growth rate of around 33%. Importantly, this represents infrastructure investment rather than semiconductor revenue but nevertheless illustrates the enormous demand likely to be created for servers, accelerators, HBM memory, storage, networking equipment and data-centre capacity. IDC also expects Generative AI spending to expand even faster over the next few years (around 60% p.a.), although this rate will naturally moderate as the market matures and becomes more widely adopted.
- The ultimate prize actually lies beyond the technology sector itself! McKinsey estimates that Generative AI could generate between $2.6tn and $4.4tn of additional annual economic value globally. Approximately 75% of this opportunity is expected to come from just four business functions: customer operations, marketing & sales, software engineering and research & development. It is important to distinguish this from technology company revenues—much of this value is likely to emerge through higher productivity, lower operating costs and stronger profitability across companies using AI.
- There are three distinct AI earnings pools:
Infrastructure profits – captured initially by Nvidia, AMD, Broadcom, memory manufacturers (SK Hynix, Samsung, Micron), foundries (TSMC) and networking/equipment suppliers. This is currently the largest and most visible earnings pool, but also the most cyclical. Platform & Software profits – generated by hyperscalers, cloud providers, AI model developers and enterprise software companies. Earnings growth should remain strong, although investors are increasingly demanding evidence that today’s unprecedented investment can generate attractive long-term returns. Productivity profits – ultimately captured by banks, manufacturers, retailers, healthcare companies, professional services firms and many other businesses applying AI to improve efficiency, margins and returns on capital. This is likely to become the largest long-term earnings pool, although it remains the most difficult to quantify today. - Spending growth should not be confused with earnings growth. Strong demand for AI infrastructure is supportive of revenues, but shareholder returns will ultimately depend upon pricing power, competition, depreciation, energy costs, financing costs and returns on invested capital (ROIC). Likewise, increasing Chinese competition, custom-designed chips, internal semiconductor development by hyperscalers and expanding manufacturing capacity are all likely to place downward pressure on margins over time.
- AI workflow penetration remains in its infancy. Although most large organisations have already begun deploying AI somewhere within their businesses, deep integration into economically meaningful workflows remains relatively low. Most published studies suggest AI workflow penetration could increase by approximately three to five times over the next five years across many sectors. This implies continued growth in AI investment, semiconductor demand and earnings opportunities, although the beneficiaries are likely to broaden progressively beyond today’s infrastructure leaders. (Sources: Stanford AI Index, McKinsey, IDC, Gartner, OECD.)
CONCLUSION: I believe global AI adoption is still in its early stages. I don’t see the recent market correction as a reassessment of AI demand ; instead, I see it as a reassessment of future returns on AI investment. Current earnings remain exceptionally strong, especially across semiconductors, memory and AI infrastructure……but markets are increasingly questioning whether these companies can sustain today’s margins as competition intensifies and supply expands. As value migrates from companies building AI infrastructure to those deploying AI most effectively, the larger opportunity will emerge as! AI adoption is unlikely to be the constraint over the next decade. The challenge, for investors, will be identifying which parts of the AI value chain can convert that adoption into sustainable earnings, FCF and attractive ROIC.
MARKET SUMMARY…
- The US has pulled some 100mn barrels from its SPR; Oil at $70pb or less simply doesn’t cut it for oil producers. Back to “normal” operations seems like a pipe dream – especially as both the Hormuz and Bab al Mandab choke points are under attack.
- Markets are struggling to come to terms with Kevin Warsh’s approach. His perceived “bare-bones” communication style is accentuating market jitters. Rates were left on hold – but only following an intense debate where three members argued strongly for a rate rise due to inflation pressures! Some say he’s following Trump’s playbook by not raising rates. Warsh is actually waiting for evidence of sustained inflation. He is focused on the productivity/supply side of the economy and whether it can absorb inflationary pressures. Meanwhile, higher bond yields do the job of rate increases! Nonetheless, investors have been unimpressed and markets have been dumping 30y Treasuries sending yields to a 19-year high on concerns Warsh is not fully committed to taming inflation. Traders have trimmed bets for a September rate hike.
- PM Sanae Takaichi has decided to cut Japan’s sales tax for food and beverages to 1% (from 8%) for two years from April; meanwhile, the government has reduced its full year growth forecast to 0.9% (from 1.3%) due to the impact of higher energy prices on consumer and corporate profits.
- ECB figures indicate EZ wage growth is set to slow this year to 2.6% y/y (from 3% y/y in 2025).
- The BoE kept rates on hold for the 5th consecutive time and expects it to rise again this year.
- US Personal incomes rose 0.2% m/m while the spending personal consumption expenditures rose 0.3% m/m. Both were a little below expectations. The PCE Price Index fell -0.1% m/m and is running at 3.7% y/y (Fed’s primary forecasting gauge). The core rate rose 0.1% m/m and is running at 3.3% y/y. Q2 GDP printed just 1.5% q/q (vs 2.1% in Q1; 1.8% had been expected).